The latest EIU rankings pull back the curtain on the everyday realities that shape how comfortable and secure a city feels. Beyond glossy skylines and historic charm, these scores weigh stability, healthcare, culture and environment, education, and infrastructure. If you have ever wondered why some global hubs still feel tough to navigate, the data tells a sobering story. Keep reading to see how these 15 cities landed among the least livable and what that means on the ground for residents like you.
Damascus, Syria
Damascus sits at the very bottom of the 2025 index, with a score near 30.7 out of 100. Years of civil war have fractured stability, strained healthcare, and disrupted basic services. You can feel it in the inconsistent water, power outages, and the difficulty of getting reliable transport.
Daily life often becomes a calculation of tradeoffs: safety, access to clinics, and the long wait for public services. Schools and hospitals work under pressure, while rebuilding moves slowly. Even small errands can become complex, and the gap with other low ranked cities stays stark.
While parts of the city retain deep cultural heritage, conflict has reshaped the entire urban rhythm. The Stability category drags down the overall rating most sharply. For residents, resilience is a necessity rather than a choice, and comfort remains out of reach.
Tripoli, Libya
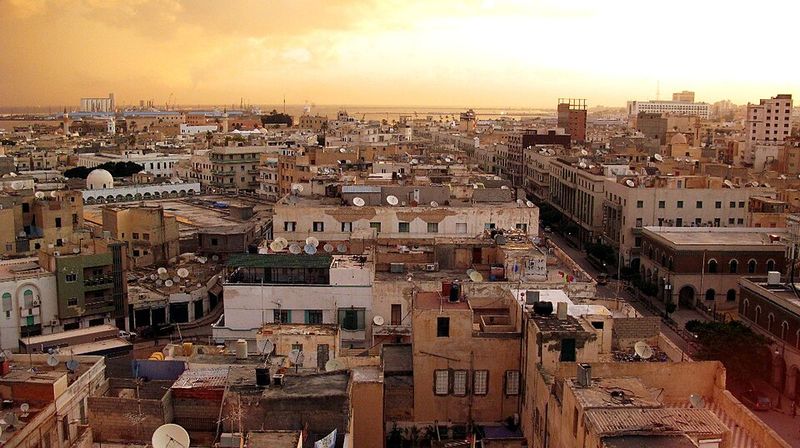
Tripoli ranks 172 out of 173, reflecting persistent unrest and fragile governance. Stability scores are especially low, with security risks shaping daily routines. You notice frequent power interruptions and strained public services that complicate normal life.
Healthcare and infrastructure indicators underperform, limiting access to clinics and reliable transport. Commuting can be unpredictable, and water or electricity may cut unexpectedly. The uncertainty keeps residents on edge and erodes confidence in urban systems.
Tripoli’s historic richness contrasts with present day fragility. Without sustained improvements in stability and civic capacity, comfort remains elusive. People adapt, but the margin for error is thin and the city’s rank stays near the bottom.
Dhaka, Bangladesh
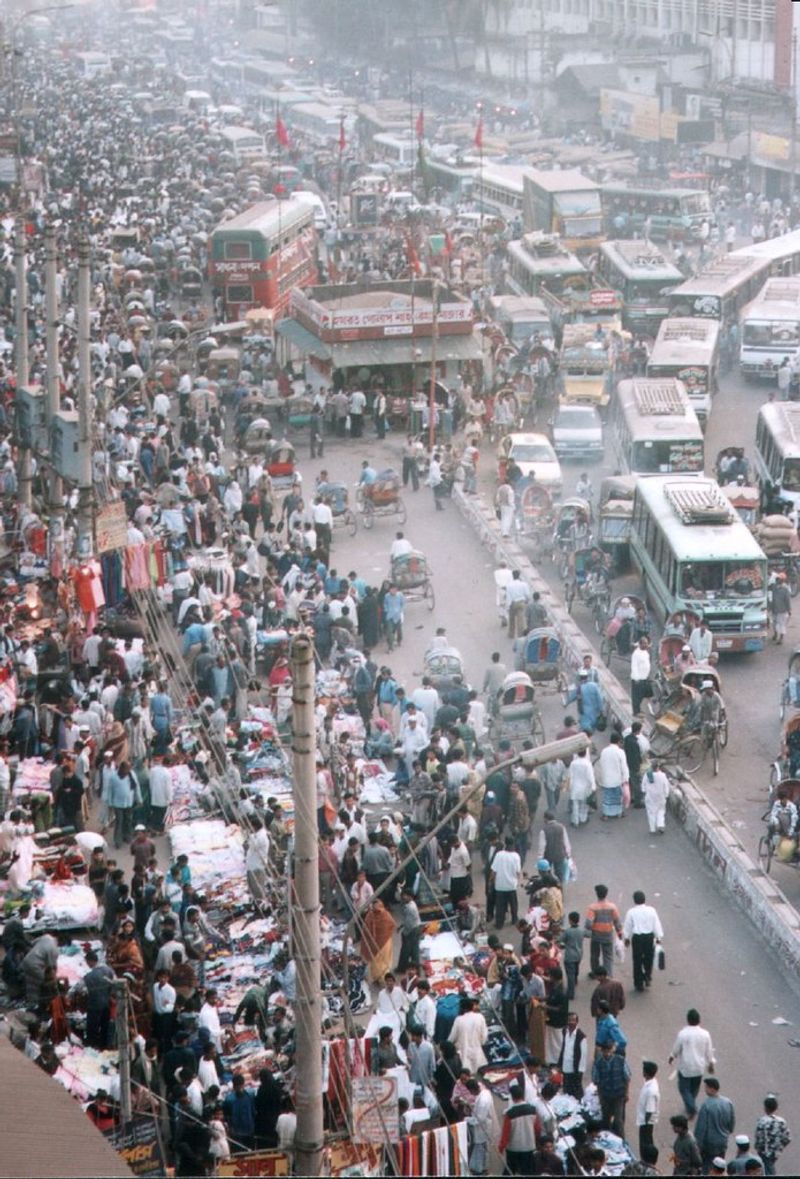
Dhaka places around 171 with a liveability score near 41.7. Extreme density presses infrastructure and public services to their limits. You encounter congestion, housing pressure, and frequent flooding that magnify daily stress.
Healthcare and education have improved, yet growth outpaces capacity. Culture and environment scores lag due to pollution, noise, and limited green space. Commuting can stretch hours, and basic errands demand patience.
Climate vulnerability compounds the challenge, especially during heavy rains. Drainage and transport networks struggle to cope, affecting safety and productivity. With infrastructure lagging demand, the overall experience remains difficult despite ongoing reforms.
Karachi, Pakistan
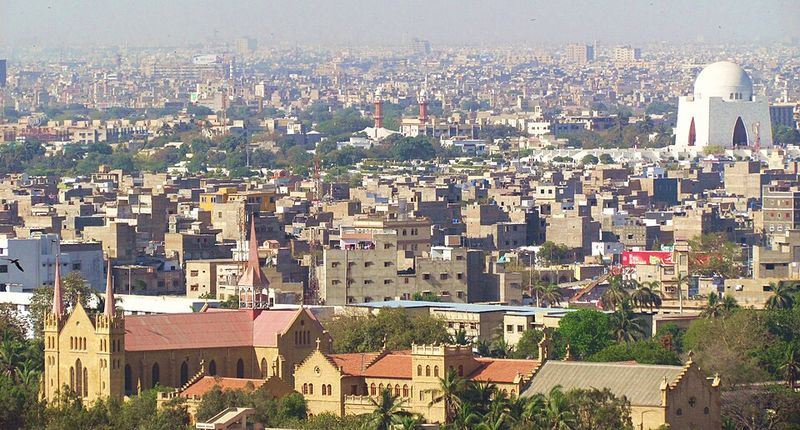
Karachi scores about 42.7 and ranks around 170, reflecting severe pressure on stability and infrastructure. High crime, congestion, and uneven public services define everyday reality. You can expect long commutes and interruptions in utilities.
Healthcare systems are stretched and access varies widely by neighborhood. Inequality widens gaps in safety and service quality, shaping starkly different experiences across the city. Basic tasks often require backup plans and time to spare.
The city’s scale and economic role are undeniable, but under investment leaves persistent deficits. Where services improve, demand surges and outpaces gains. Until stability and infrastructure catch up, liveability stays low.
Algiers, Algeria
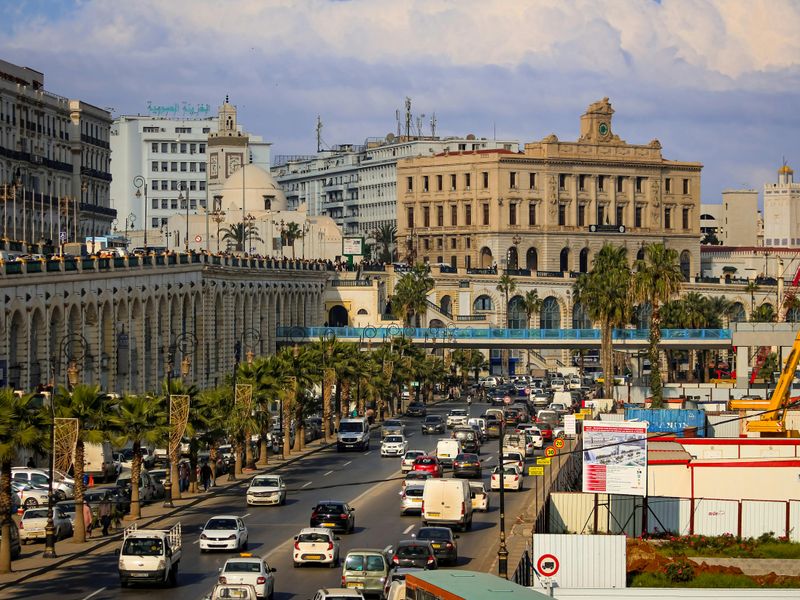
Algiers sits near 169 with a score around 42.8. Healthcare performs somewhat better than peers at the bottom, but infrastructure and stability remain weak. You feel it in traffic jams, aging utilities, and uneven urban services.
Public transport struggles with reliability and reach. Upgrades occur, yet long standing gaps limit daily comfort for commuters and families. Small disruptions cascade into delay and frustration.
The city’s cultural assets cannot offset systemic constraints. Without steadier governance and infrastructure renewal, progress stalls. Residents adapt routines to cope, but liveability lags behind more developed peers.
Lagos, Nigeria
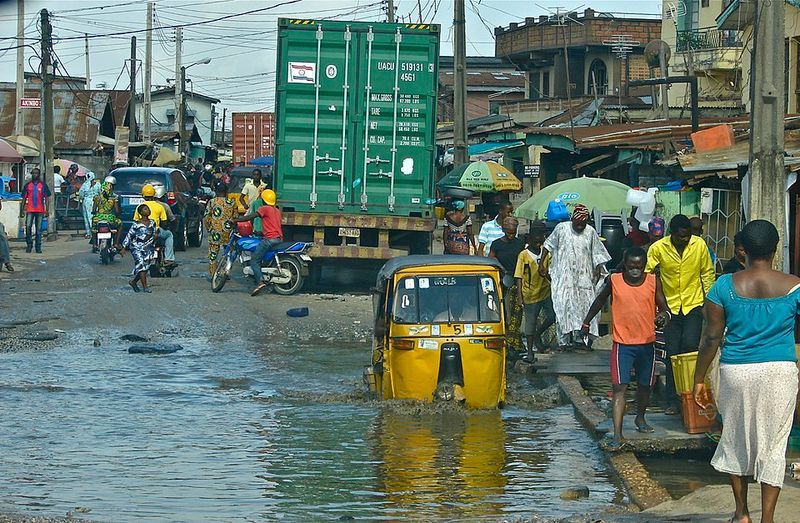
Lagos ranks about 168 with a score near 43.5. Overcrowding, traffic, and unreliable infrastructure weigh heavily on daily life. You may deal with power cuts, water scarcity, and long commutes.
Rapid growth has outpaced public service expansion. Security concerns and environmental hazards add to stress, especially for vulnerable communities. Housing shortages push many into informal settlements with limited amenities.
The economy is vibrant, but urban systems strain under demand. Without modern transport and utilities at scale, comfort remains inconsistent. The liveability score reflects chronic service gaps rather than a lack of energy or potential.
Harare, Zimbabwe
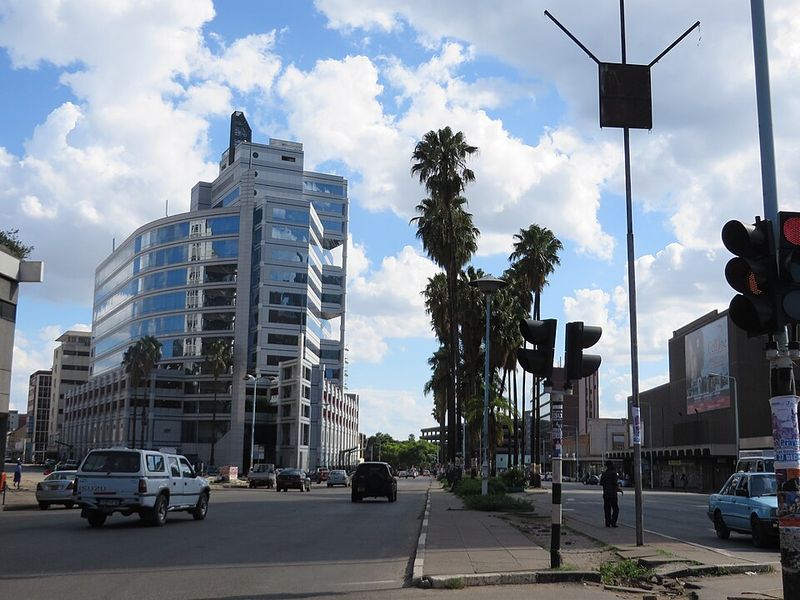
Harare ranks around 167 with a score near 43.8. Healthcare access is poor, and infrastructure struggles with maintenance and funding. You often encounter service interruptions and limited options for reliable care.
Economic instability and political uncertainty undermine planning and investment. While culture and environment can show bright spots, basics like transport and utilities fall short. Everyday activities require flexibility and backup arrangements.
Residents balance optimism with fatigue as repairs lag demand. Stabilizing institutions and investing in core services would bring quick wins. Until then, the liveability profile stays constrained.
Port Moresby, Papua New Guinea
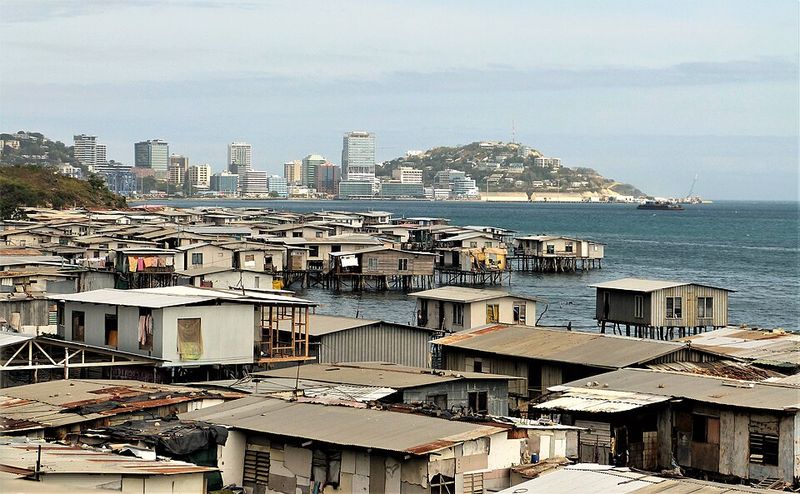
Port Moresby sits near 166 with an overall score around 44.1. Infrastructure deficits are severe, and service delivery is costly and limited. You notice gaps in healthcare capacity and transport connectivity.
Low stability and safety concerns shape daily choices. Commuting, accessing clinics, and securing utilities can take considerable time and money. Businesses face similar frictions that raise prices and reduce reliability.
Geography complicates expansion, but governance and funding shortfalls deepen the challenge. Incremental projects help yet rarely keep pace with need. The result is a difficult living environment for residents and visitors alike.
Kyiv, Ukraine
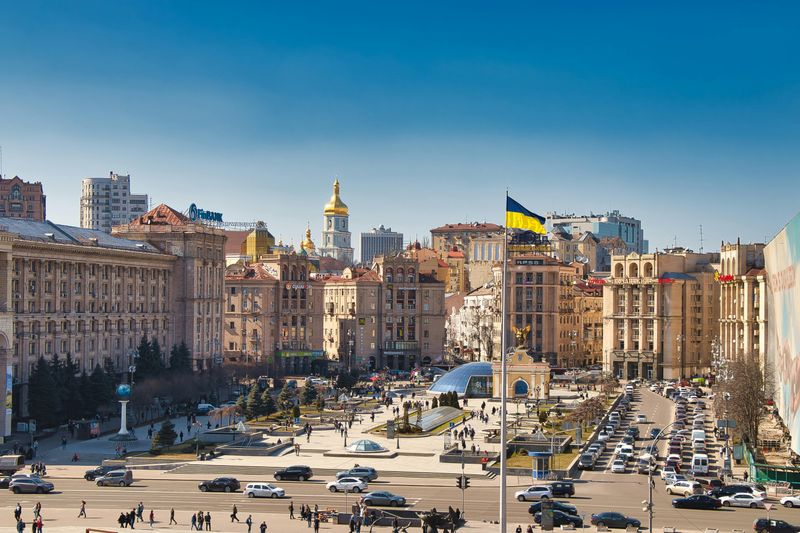
Kyiv appears around 165 with a score near 44.5. War related risks dominate stability and infrastructure metrics. You see it in damaged roads, disrupted services, and heightened security checks.
Education scores remain comparatively higher, reflecting strong institutions under strain. Healthcare capacity is pressured by conflict dynamics and resource constraints. Commuting and logistics require contingency plans.
Despite resilience and community effort, the conflict depresses liveability. Repairs proceed where possible, but uncertainty limits long term investment. The ranking primarily reflects instability rather than the city’s underlying potential.
Caracas, Venezuela

Caracas ranks about 164 with a score near 44.9. Economic collapse, inflation, and crime undercut stability and access to services. You may face shortages, long lines, and unreliable power.
Healthcare capacity is inconsistent, and infrastructure maintenance lags. Education indicators show some moderate results, but they cannot offset deeper systemic strain. Transport interruptions and safety concerns remain common.
Community networks help residents navigate daily hurdles. Still, the liveability score reflects persistent fragility across core categories. Without macroeconomic stabilization, improvements will be hard to sustain.
Jakarta, Indonesia
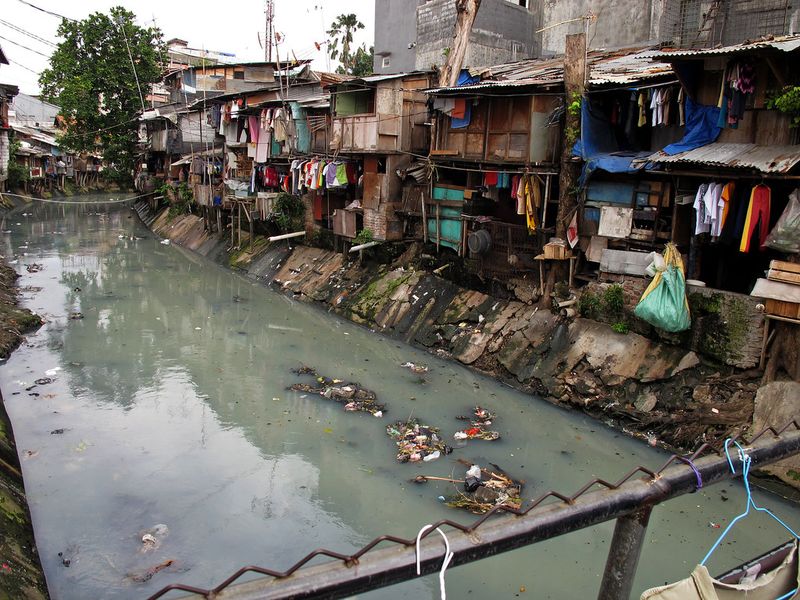
Jakarta’s liveability sits in a lower tier with a score near 51.7. Flooding, congestion, and air pollution reduce comfort and predictability. You can spend hours in traffic while drainage systems struggle during heavy rain.
Urban sprawl and infrastructure gaps complicate service delivery. Public transit improvements help, but demand keeps rising faster than capacity. Housing and environmental pressures amplify daily costs and risks.
The city is dynamic and economically vital, yet quality of life hinges on mobility and clean air. Until resilience projects scale, disruptions will continue. The ranking reflects that tension between growth and livability.
Bogotá, Colombia
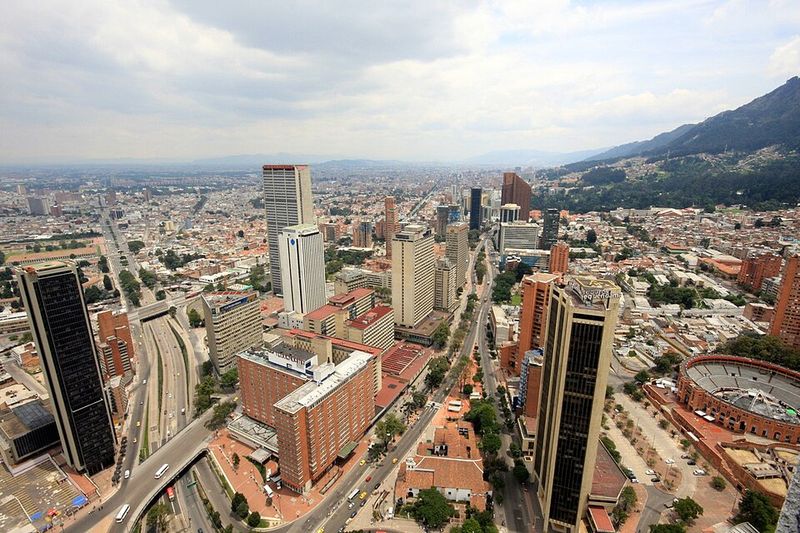
Bogotá scores around 51.4, placing it in the lower third. Crime concerns, complex transport, and inequality shape everyday experience. You may rely on buses that are packed and prone to delays.
Healthcare and education are moderate but vary by district. Infrastructure expansion trails the needs of a growing population. Long travel times and safety tradeoffs become routine.
City initiatives aim to improve transit and public space, yet progress is uneven. The liveability score reflects these systemic frictions. Until mobility and security stabilize, comfort remains inconsistent.
Cairo, Egypt
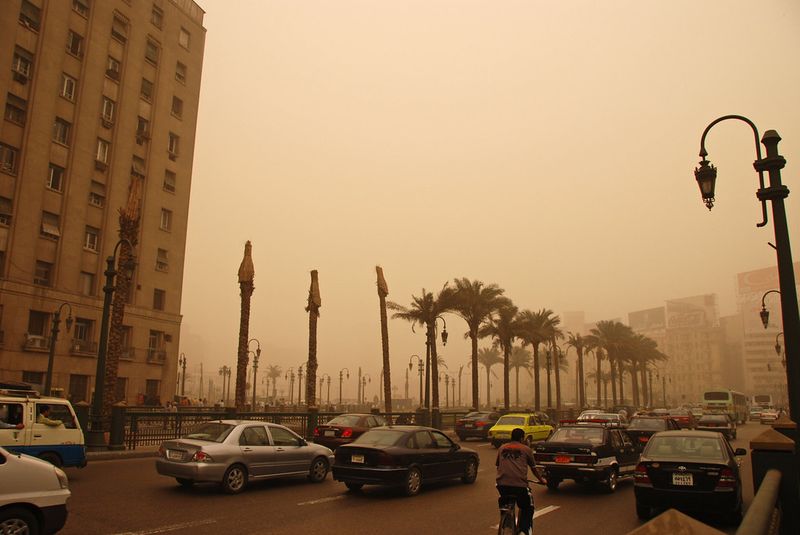
Cairo posts a score near 47.8, landing in a lower bracket. Congestion and pollution dominate the daily experience, limiting comfort and health. You often plan around gridlocked bridges and long cross town trips.
Infrastructure is strained by rapid growth and aging utilities. Public services struggle to keep pace, even as selective upgrades roll out. The gains get diluted by sheer demand and complexity.
Stability is comparatively better than conflict zones, but quality of life remains compromised. Incremental improvements help, yet systemic relief feels distant. The ranking captures a city that is resilient but overburdened.
Tehran, Iran
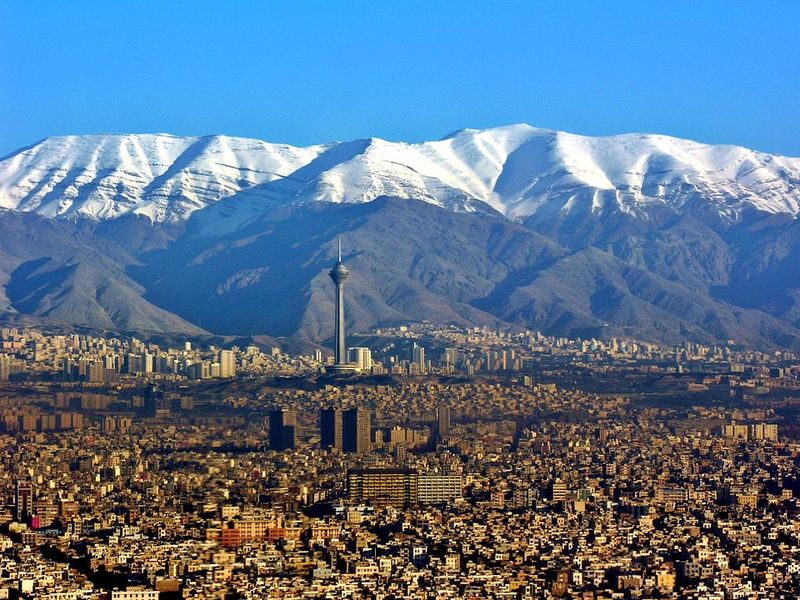
Tehran’s liveability score sits around 46.3. Stability, infrastructure, and education indicators collectively weigh it down. You contend with traffic, pollution, and uneven service delivery.
Geopolitical risk complicates investment and planning. While cultural life is vibrant, access and affordability vary widely. Healthcare can be capable in parts, but consistency is an issue.
Progress depends on broader policy shifts and urban upgrades. Without them, daily friction accumulates and undermines comfort. The city’s score reflects these layered constraints rather than a lack of potential.
Hanoi, Vietnam
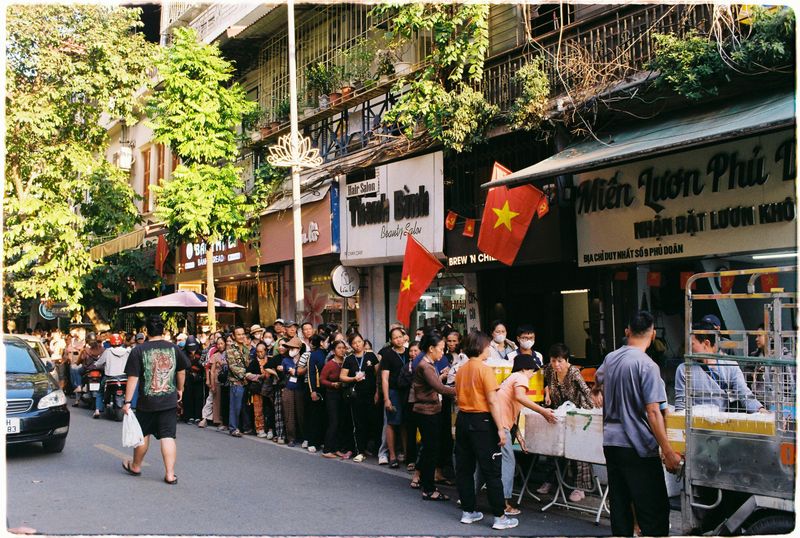
Hanoi scores roughly 55.5, still in a lower scoring cohort despite steady improvements. Congestion and infrastructure stress shape commuting and logistics. You will notice air quality dips and pressure on public space.
Education and healthcare trends are improving, yet demand outruns capacity. Environmental concerns, including noise and emissions, add daily fatigue. Flooding risk during storms complicates mobility.
As upgrades roll out, reliability should improve over time. For now, long travel times and crowded corridors remain common. The ranking reflects a city in transition, balancing growth with liveability.