What if skyscraper-high waves rose in empty oceans and nobody saw them until satellites did? That is exactly what happened, and the implications reach far beyond surfers and ship captains. You are looking at a turning point where space-borne eyes are rewriting ocean risk, commerce, and coastal life. Keep reading to learn how a single storm became both a warning and an opportunity for humanity.
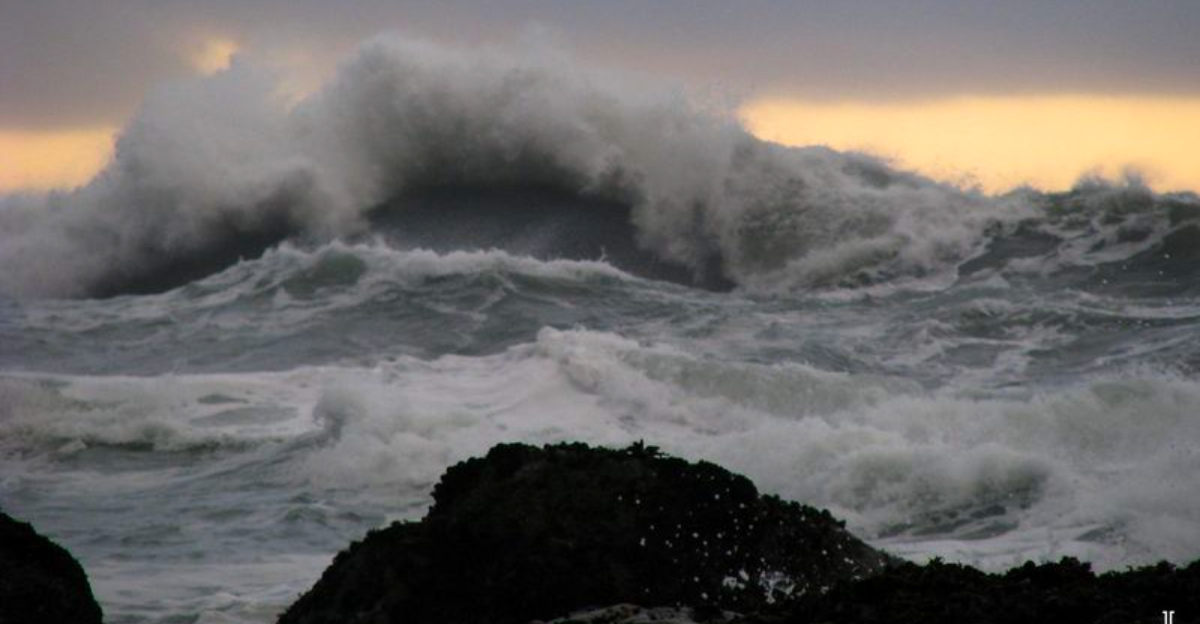
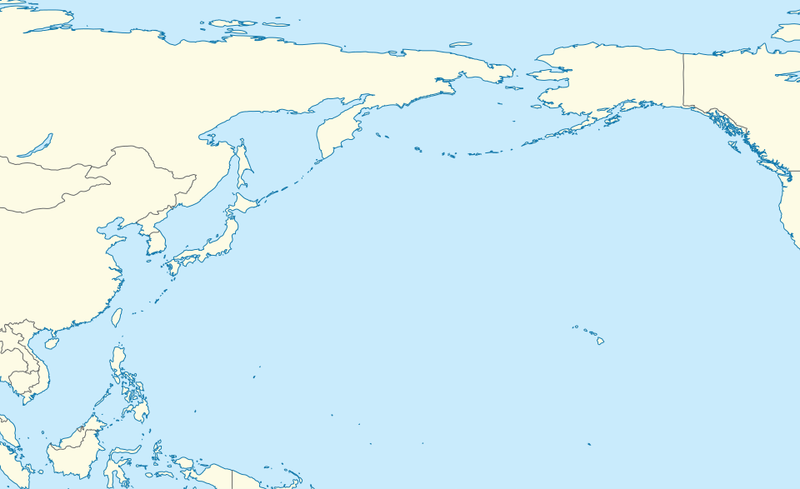
Picture the North Pacific on a winter night, no ships in sight, just black water heaving under moonlit clouds. Satellites swept overhead, quietly measuring a sea pushed into rare extremes, catching waves that climbed toward 35 meters. You do not need to be onboard to feel the scale when the data spells out a ten-story wall of water.
From space, radar pulses painted the ocean surface with millimeter-level precision, turning a storm’s chaos into coherent numbers. These were not lucky snapshots but deliberate passes that stitched together a mosaic of height, period, and direction. Suddenly, the tallest waves no longer depended on witness accounts or bruised hulls.
The confirmation matters because it changes what we prepare for. Ports, insurers, mariners, and coastal planners can now recognize the true ceiling of ocean energy. That knowledge gives you time to plan instead of hope.
Storm Eddie earned its name the hard way, spinning up in December 2024 with ferocity that bent instruments and models to its will. Researchers revisited the event in 2025, pooling satellite passes, scatterometers, and reanalysis fields. When the dust settled, Eddie ranked among the most extreme wave producers ever recorded.
You can picture those wind fields like invisible hands raking the sea, stacking energy into long-period giants. The numbers did not whisper. They shouted in consistent patterns across independent datasets, removing doubt and myth.
By tying the waves to a named storm, scientists gave mariners and forecasters a benchmark anchor. Next time a similar footprint appears, warning systems can escalate earlier with confidence. For you, that means fewer surprises and clearer decisions, whether routing a vessel, insuring a cargo, or planning coastal operations. Eddie became a case study, and case studies become standards.
NASA’s SWOT satellite was built to map water with audacious precision, and it delivered. Using Ka-band radar interferometry, SWOT measured sea surface height variations that translate directly into significant wave height. You get a clean, physics-backed picture of a storm’s muscle without sending ships into harm’s way.
During Eddie, SWOT resolved a significant wave height near 19.7 meters, a figure that alone can threaten modern cargo ships. Significant height is not a single wave but a statistical measure, yet it foreshadows what the biggest crests can do. Think of it as the storm’s engine displacement, not just the rev needle.
For routing decisions, that number is actionable. It helps captains alter course days earlier and insurers price risk with sharper pencils. You are not guessing anymore. You are reading the ocean’s handwriting from orbit, line by line.
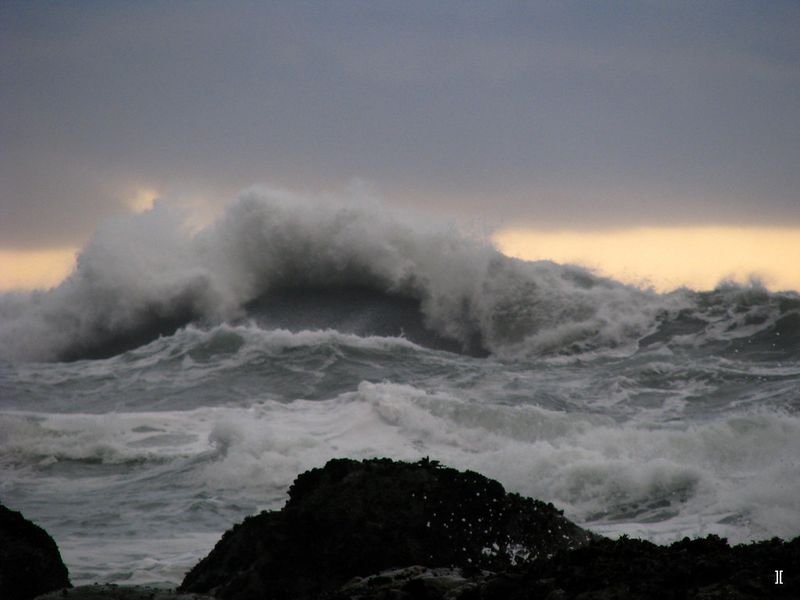
Within Eddie’s field, individual wave crests surged far beyond the average, scraping toward 35 meters. That is where statistics meet adrenaline. You can feel the difference between a heavy sea and a freak wall that rises out of pattern, slams, and vanishes.
Scientists estimated these peaks by blending significant height with directional spectra and model reconstructions. The math is disciplined, but the result is visceral. Such spikes confirm that rogue behavior is not just at the tails, it is structural in extreme storms.
For you, this means design margins and safety protocols must account for rare giants, not merely typical peaks. Ships, offshore platforms, and wind turbines encounter risk that is intermittent yet catastrophic. With satellites flagging these zones, operators can throttle speed, shift headings, or pause operations. Preparation is not fear. It is the difference between a story and a statistic.
The swell did not die with Eddie. It unfurled around the planet, traveling roughly 15,000 miles, slipping past the Aleutians, through the Drake Passage, and into the tropical Atlantic. You might have watched a calm beach start breathing harder days later and never known why.
Long-period waves carry energy with surprising efficiency, losing little as they cross basins. Satellites and buoys stitched the journey together, confirming that the storm’s signature survived across hemispheres. This is a reminder that local forecasts are often global stories in disguise.
Shipping routes adjusted to ride or avoid the extra heave, and coastal communities felt unusual sets arriving out of season. For you, the takeaway is practical. A storm you cannot see can still change your schedule, your cargo costs, or your shoreline. The ocean is a network, and energy follows its own timetables.
Old sea tales spoke of killers that rose without warning. Today, satellites like SWOT, Jason-3, and Sentinel-3 return hard numbers, pinging the ocean with radar that picks up centimeter-level changes. You can trust the measurements because multiple eyes cross-check the same patch of sea.
With every pass, archives grow, and the myths shrink. Rogue waves are not ghosts. They are outliers with signatures we can now detect, map, and forecast probabilistically.
This shift helps you separate drama from danger. The stories become datasets, which become advisories routed to bridges and ports in real time. Once that happens, training changes, insurance clauses evolve, and operations adopt intelligent go or no-go thresholds. The ocean is still wild, but it is also quantified. Knowing that saves lives and gear without killing the awe.
Oceanographers use a crisp definition: a rogue wave is roughly twice the significant wave height of the surrounding sea. In extreme fields, that threshold can sit near 28 meters, and Eddie crossed it. You do not need folklore when a formula tells you where danger starts.
This matters because definitions drive engineering choices. Hull scantlings, lifeline heights, and turbine clearances all lean on numbers set in standards. When the threshold is breached, designs and protocols must move too.
For you, a clear rule of thumb turns uncertainty into action. If forecasts call for a significant height of 14 meters, then rogues could top 28. That cues reduced speed, altered headings, and secured decks. It is a tidy bridge between physics and practice, where a single ratio can change a voyage plan before the first wave hits.
Look beyond one storm and the trend grows louder. Long records show rising average and extreme wave heights across roughly one-third of the global ocean since the 1980s. You might not notice in a single season, but shipping logs and satellites do not forget.
The Southern Ocean stands out, but the signal bleeds into the Pacific and Atlantic too. It is a slow ratchet, tightening stresses on hulls, ports, and coasts. Maintenance cycles shorten. Insurance payouts rise.
For your world, that means planning for seas that age infrastructure faster than expected. Breakwaters designed decades ago are absorbing more energy than their blueprints anticipated. The quiet part is over. As datasets thicken, the case for updated design codes and route planning becomes undeniable. Better forecasts protect both balance sheets and lives, turning a trend line into a to-do list.
Between 1985 and 2018, the Southern Ocean saw average wave heights rise by nearly 30 centimeters. Total wave energy increased about 8 percent since the 1980s. If you sail those latitudes, you have likely felt it in your bones, even before the graphs told the story.
This is the planet’s wave factory, driven by relentless westerlies that sprint around Antarctica with few obstacles. A small increase in height compounds into big loads on ships and coastal structures. Energy goes up faster than intuition suggests.
For you, that translates into higher fatigue on steel and composites, more green water on decks, and sharper windows for safe work. Offshore wind, fisheries, and research expeditions all pay the tax. The Southern Ocean has always been stern. Now it is incrementally stronger, and planning needs to catch up with the physics.
In 2024, the western Pacific swelled with a marine heatwave spanning 40 million square kilometers. That is five times the size of Australia, an area so vast you can feel the scale just by saying it out loud. Warmer water loads the atmosphere with moisture and energy.
The World Meteorological Organization flagged the event as extraordinary, but it fits a broader pattern. Heat is not staying in the air. It is sinking into the ocean, where it lingers and amplifies storms.
For you, this means stronger cyclones, trickier forecasts, and bigger swells arriving in places that rarely saw them. Fisheries shift. Coral bleaches. Supply chains wobble as ports face new wind and wave regimes. The ocean is the planet’s heat bank, and the balance is changing in ways that roll directly into weather, waves, and your calendar.
By 2023, studies showed 96 percent of the global ocean experiencing extreme marine heatwaves. Warm water is stored energy, and storms are machines that spend it. You do not need a doctorate to see the chain: more heat, stronger winds, taller waves.
The feedback loops are practical. Stronger storms deepen faster, expanding the fetch that builds long-period swells. Forecast offices now treat ocean heat content as a core input, not a side note.
For you, this points to a new normal in routing and coastal planning. Bigger waves raise fuel costs, slow schedules, and test moorings that once felt bulletproof. That is not panic. It is a reason to adopt better forecasts, sturdier designs, and smarter insurance. The physics is not asking permission, but it is giving clear signals you can act on.
Extreme waves are not just surfer lore from Waimea Bay or Mavericks. They reshape shipping routes, change fuel burn, and alter delivery schedules that your business quietly depends on. Bigger sets eat beaches, overwhelm drains, and push saltwater into places it does not belong.
On a stormy weekend, the spectacle thrills. The bill arrives later as erosion, flooded basements, and stressed piers. Insurance adjusters count what the crowd miscounts.
You can turn warning into opportunity. Invest in earlier routing calls, resilient coastal design, and real-time port monitoring. Share data across agencies and fleets so each storm writes a smaller check. The ocean is loud, but the path is clear. With satellites watching, the decisions you make today can keep tomorrow’s waves from becoming yesterday’s regrets.