If you have ever wondered which U.S. cities face the toughest natural hazard outlooks, FEMA’s National Risk Index offers a data grounded lens. It blends hazard exposure, expected losses, community vulnerability, and resilience to show where impacts could hit hardest. While the Index is county based, you can still see how cities inherit those risks from the counties that surround them. Use this guide to understand where the numbers point and what that means for people, homes, and daily life.
Houston (Harris County, Texas)

Houston sits inside Harris County, a place FEMA’s National Risk Index consistently flags for hurricane and flood exposure. You can feel the stakes whenever rain lingers over flat neighborhoods and bayous run high. With massive infrastructure and dense development, expected losses climb quickly once storm surge, wind, and inland flooding stack together.
The memory of Harvey still shapes preparation. You see higher freeboard requirements, buyouts near repetitive loss properties, and stronger building codes in newer projects. Yet legacy drainage, pavement heavy growth, and subsidence keep flood risk stubbornly present.
For families, that means checking flood maps, updating insurance, and planning evacuation routes even far from the coast. Businesses harden data centers, elevate critical equipment, and diversify power backups. When Atlantic waters warm and storms intensify, preparedness turns into a routine you practice, not a plan you file away.
Local resilience rises through buyouts, green stormwater projects, and bayou restoration that creates room for water. You notice neighborhoods elevating homes and parking lots redesigned as temporary detention. The Index does not rank cities outright, but Harris County’s composite risk remains unmistakably high.
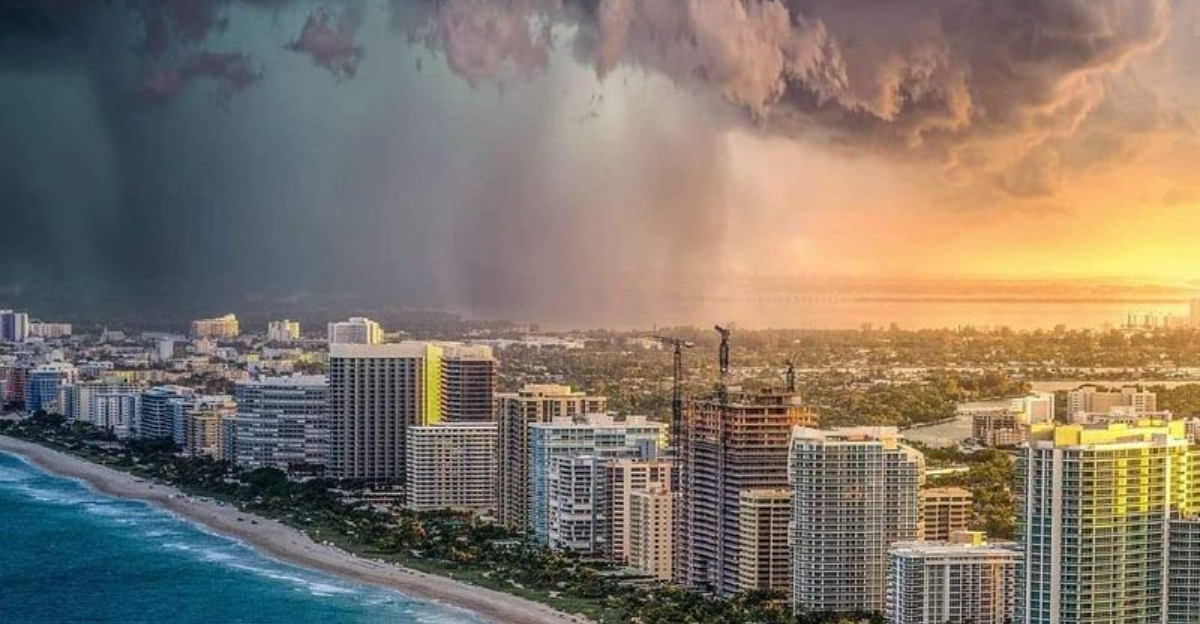
Miami (Miami-Dade County, Florida)
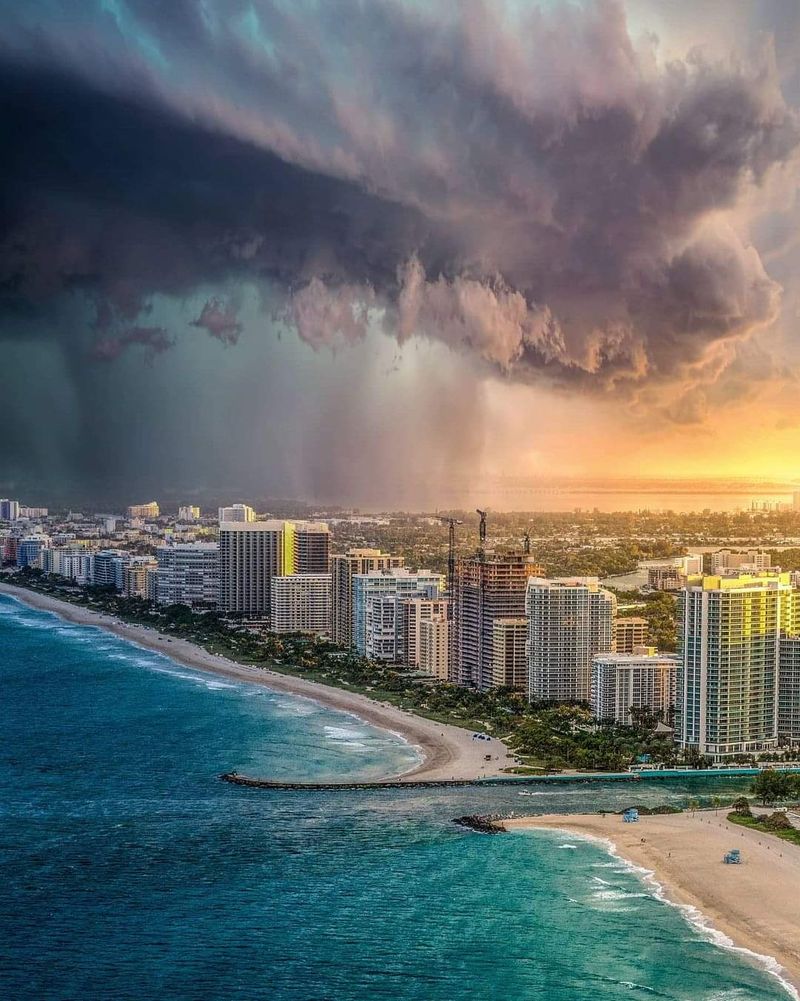
Miami-Dade lives at the crossroads of warm Atlantic waters, low elevation, and booming coastal development. FEMA’s Index reflects this with high expected annual loss for hurricane winds and coastal flooding. You can see it in king tide puddles, the rush to elevate equipment, and seawalls straining against higher baselines.
You feel urgency in building codes, storm shutters, and backup power norms that become part of daily life. Evacuation planning is not abstract here. When forecasts track long Caribbean fetch, everyone checks surge zones and fuel levels and clears drains before the first squall line arrives.
Investments in pumps, raised roads, and resilient microgrids offer hope, but the math is unforgiving. Exposure is large, values are high, and downtime can ripple through tourism and trade. That makes insurance literacy and mitigation grants essential tools for households and small businesses.
Neighborhoods test permeable pavements, mangrove restoration, and cool roof programs to fight heat and flood together. The Index’s county focus underscores how Miami’s risk is woven across municipalities. You move with the rhythm of storm seasons, learning to prepare early and recover faster.
New Orleans (Orleans and surrounding parishes, Louisiana)
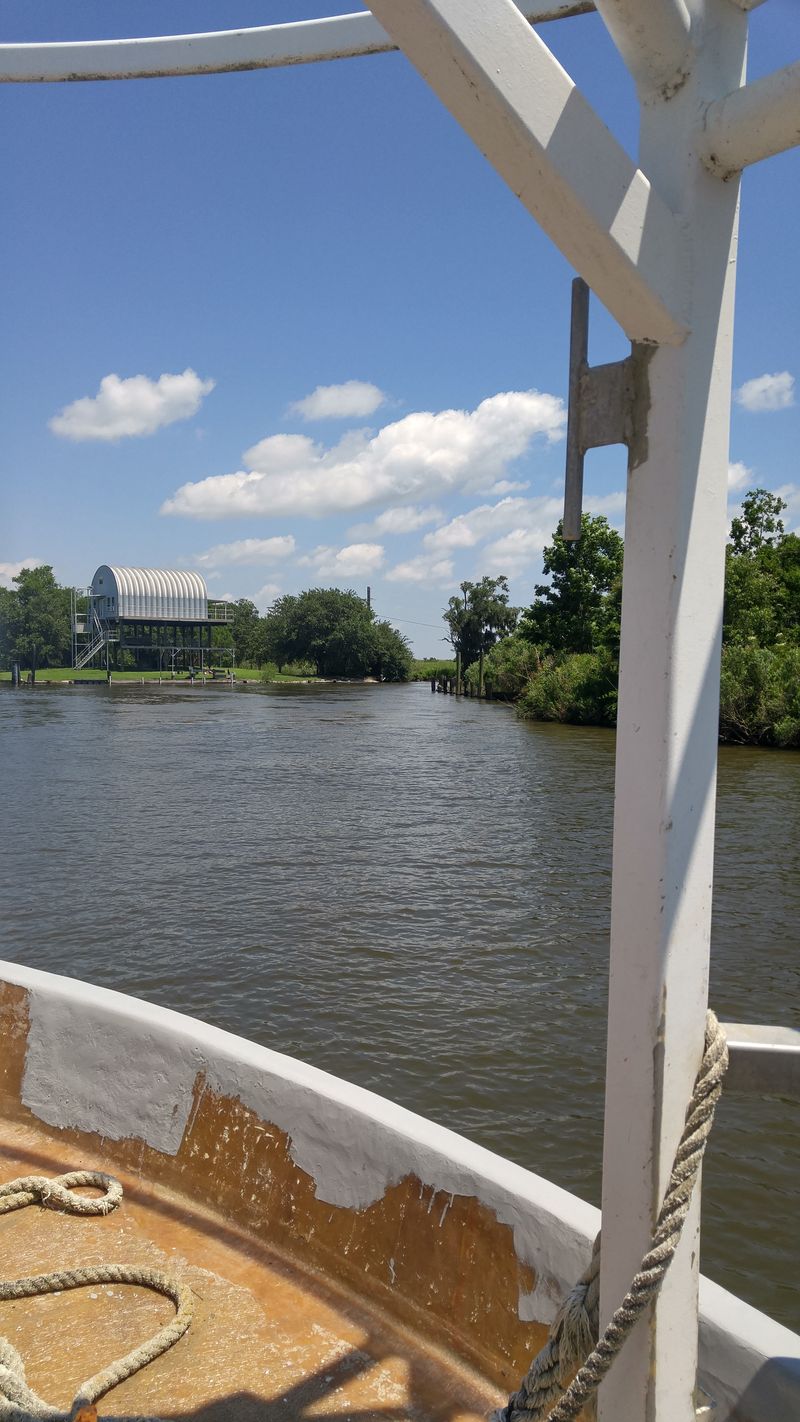
In New Orleans, risk is shaped by water on every side and history etched into levees. FEMA’s National Risk Index highlights high exposure to hurricanes, storm surge, and flood, reflecting lessons learned the hardest way. You see it in pump stations, gate structures, and elevated homes that have become part of the skyline.
Life here means reading cone forecasts and river levels like a second language. Neighborhoods coordinate rides for evacuations, stash vital documents, and track boil water advisories. Cultural heartbeat thrives, but preparedness is woven into festivals, school calendars, and supply lists.
Upgrades since Katrina and Ida reduced some vulnerabilities, yet subsidence and wetland loss keep pressure on defenses. Insurance remains a financial stress, so mitigation credits and retrofits matter. You prepare for prolonged power outages with generators and neighbor check-ins.
Parishes across the metro share linked fates, from Plaquemines to Jefferson. Surge pathways and rainfall extremes can compound, making drainage maintenance and backup pumps everyday priorities. The Index does not name cities, but parish data paints a clear picture of elevated composite risk across this region.
Tampa Bay Area (Hillsborough and Pinellas Counties, Florida)
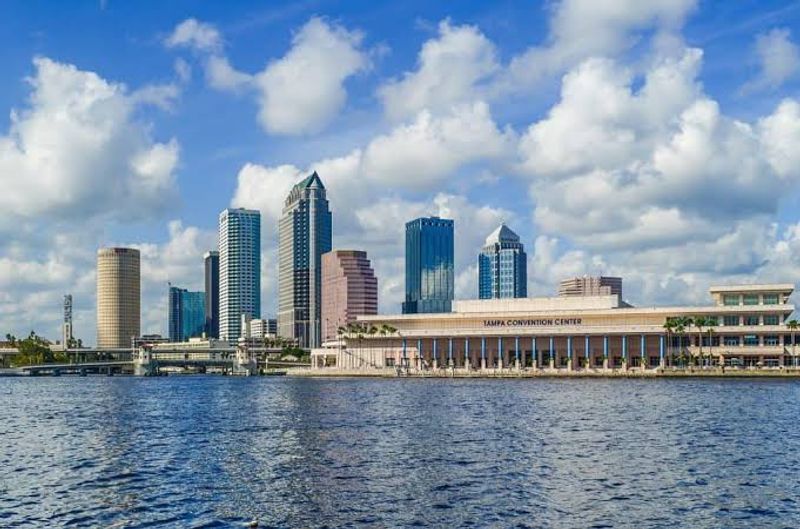
Tampa Bay’s shallow waters and dense waterfronts create a surge sensitive landscape. FEMA’s Index shows higher composite risk tied to hurricanes, coastal flooding, and heat. You feel it when late summer storms shove water up the bay and afternoon downpours exceed drainage capacity.
Across Hillsborough and Pinellas, mitigation is getting practical. Elevating HVAC, installing flood vents, and anchoring roofs becomes normal. Evacuation zones are household vocabulary, and bridges become choke points to plan around before watches turn to warnings.
Insurance costs push many to evaluate retrofits for discounts. Businesses map continuity plans, protect inventory, and cross train teams for post storm operations. Heat waves add another layer, prompting tree canopy campaigns and cooling centers that double as resilience hubs.
Seagrass restoration and living shorelines aim to tame wave energy while improving water quality. With each season, you learn which intersections pond first and which lots flood with king tides. The Index’s county basis still signals the same takeaway here, that exposure plus value keeps risk elevated.
Providence and Southern New England Coastal Counties

Southern New England’s coastal counties face a different rhythm of risk. FEMA’s Index points to elevated exposure from nor-easters, hurricanes, and coastal flooding, though frequency differs from the Gulf. You notice historic homes near the tide line and infrastructure designed long before today’s storms.
In Providence and nearby Massachusetts shores, resilience looks like floodproofed basements, raised utilities, and deployable barriers. You check moon phases for higher tides and track wind directions that pile water into coves. Early season snowmelt stacked with rain can stress rivers and culverts.
Emergency planning emphasizes multi day outages and cold weather hazards layered onto flood. Businesses protect servers, diversify suppliers, and secure rooftop equipment against long fetch winds. You see local governments upgrading seawalls and piloting living shoreline projects that absorb wave energy.
While return periods may be longer than Florida, exposure and asset concentration still push expected losses upward. Insurance markets watch closely, rewarding mitigation where possible. The Index’s county level view captures these trends across Providence, Bristol, and neighboring coastal counties.
Los Angeles Region (Los Angeles County, California)

Los Angeles County carries layered hazards that the FEMA Index elevates in composite risk. Earthquakes dominate worst case scenarios, but heat waves, wildfire exposure at the wildland urban interface, and flooding in burn scars all contribute. You plan for shaking, smoke days, and power interruptions in the same calendar.
Building codes improve seismic performance, yet contents and lifelines still drive losses. You brace furniture, secure gas lines, and store water for days. When Santa Ana winds blow, evacuation readiness and air filtration become urgent even miles from flames.
Heat turns sidewalks into griddles, so cooling centers, cool roofs, and shade trees are real adaptation, not aesthetics. Storms after fires can trigger debris flows, making alert sign ups essential. Businesses stage continuity kits, backup connectivity, and remote operations playbooks.
The Index’s county perspective amplifies risk because exposure and asset values are immense. That means small percentages translate into big numbers. You navigate this reality by mixing personal preparedness with community investments that harden infrastructure and protect vulnerable neighbors.
San Francisco Bay Area (Bay and Contra Costa Counties, California)

Across the Bay Area, earthquakes top the hazard list, and FEMA’s Index shows elevated percentiles for expected losses. You live with fault lines, soft soils, and older buildings that need retrofits. Low lying edges around the bay also face flood and sea level challenges that complicate recovery.
Personal readiness includes earthquake kits, water reserves, and strap downs for tall furniture. Businesses secure server racks, test failover sites, and map supply chain alternatives. When winter storms align with king tides, you see nuisance flooding creep across parking lots and trailheads.
Counties invest in seawalls, wetlands restoration, and seismic strengthening of bridges and hospitals. You watch bond measures fund lifeline upgrades and microgrids to stabilize critical services during outages. Heat waves are shorter than inland areas but growing, pushing cooling strategies into housing policies.
The Index aggregates county risks, and here exposure meets sky high asset values. That math drives notable expected annual losses even with strong codes. You keep go bags near the door and follow alerts because minutes matter when shaking starts.
New York City and Nearby NJ Coastal Counties

New York City’s counties and nearby New Jersey coast register elevated composite risk in FEMA’s Index. Coastal storm surge and heavy rain cause outsized impacts because infrastructure is dense and below grade. You remember Sandy’s track and how long it took some neighborhoods to fully recover.
Preparation includes floodproofing, deployable barriers, and pump capacity for subways and basements. Residents track evacuation zones and keep meds, chargers, and documents ready for rapid moves. When tropical remnants stall, street flooding and combined sewer backups can crop up fast.
City and state agencies invest in surge barriers, raised substations, and green infrastructure to soak up cloudbursts. Businesses diversify data centers, protect loading docks, and plan for multi day transit disruptions. Heat risk grows too, so tree canopy and cooling centers become life saving basics.
The Index’s county lens captures how exposure plus population density multiplies expected losses. You manage risk by acting early and staying informed, especially during late summer and fall. Here, readiness is part of urban living.
Sacramento Area (Sacramento and Placer Counties, California)

In the Sacramento region, rivers, levees, and valley topography shape flood exposure that FEMA’s Index translates into notable composite risk. You watch atmospheric river forecasts closely and understand how upstream snowpack interacts with warm storms. Heat waves and drought compound stress on people and infrastructure.
Neighborhoods near levees keep go bags and track local alert systems. Elevating critical utilities, clearing defensible space, and checking sump pumps become seasonal chores. Businesses consider water supply resilience and power backups, especially during wildfire smoke events that affect operations.
When intense rain follows dry years, soils shed water and tributaries respond fast. Agencies invest in setback levees, bypass expansions, and groundwater recharge to reduce peak flows. Cooling centers and tree canopy programs aim to protect vulnerable residents during long heat spells.
The Index’s county approach reflects how regional interdependence matters here. A single storm can challenge multiple basins at once. You lean on preparedness basics and community networks to bridge the gap until waters recede and power returns.
Phoenix and Maricopa County, Arizona
Maricopa County consistently shows high heat related metrics in FEMA’s Index, reflecting exposure, vulnerability, and population size. You feel it every summer afternoon when pavement radiates and overnight lows stay high. Monsoon storms add sudden wind, dust, and flash flooding in washes.
Households focus on hydration, shade, and reliable cooling with backup power options. Cooling centers and neighbor checks save lives, especially for seniors and outdoor workers. Businesses adjust shifts, install shade structures, and maintain HVAC redundancy to avoid costly downtime.
Stormwater projects target retention, while flood warnings emphasize never entering moving water. You keep air filters handy for dust and smoke days and store extra water as insurance against outages. Landscaping with desert friendly plants cuts water use and lowers heat around the home.
The Index’s county scale captures how small percentages become large expected losses across a vast, growing metro. Preparedness blends heat safety with monsoon awareness and insurance that recognizes flood risk outside mapped zones. You plan ahead because the heat season is long and relentless.