Every day, millions of drivers around the world sit in traffic, watching the minutes tick by as their patience wears thin. Traffic jams are not just frustrating, they waste fuel, pollute the air, delay goods, and steal precious hours from people’s lives.
Some cities have it far worse than others, and the gap between the best and worst can be staggering. Based on the 2025 INRIX Global Traffic Scorecard, here are the 15 urban areas where congestion hits hardest.
Istanbul, Türkiye
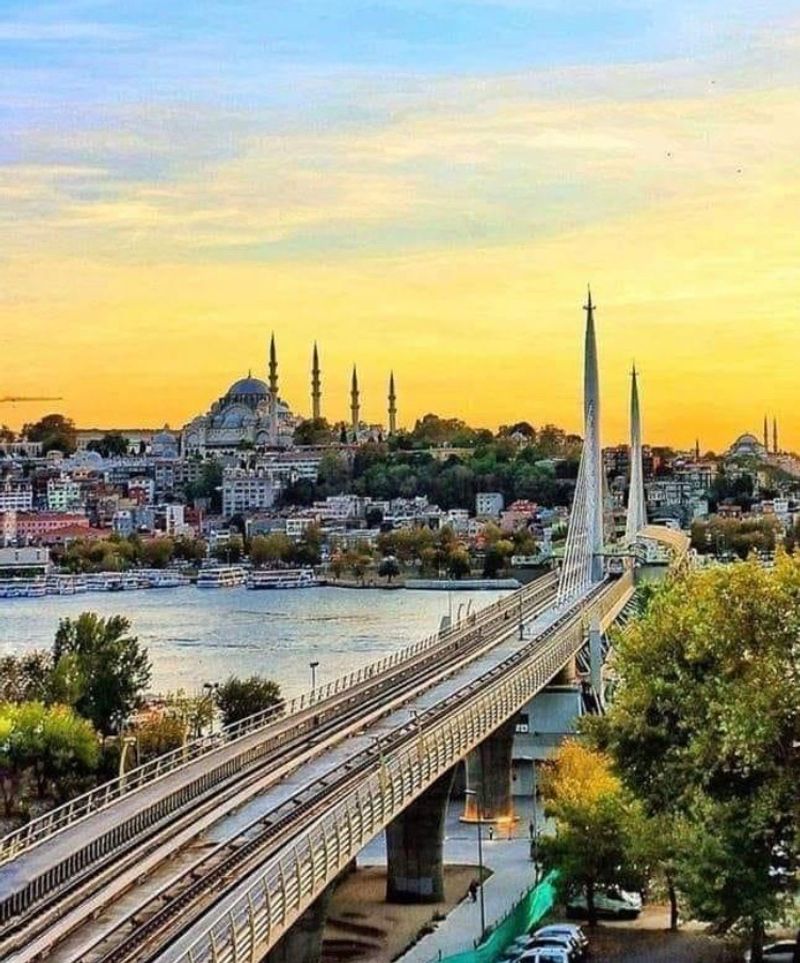
Sitting on two continents sounds glamorous until you realize getting between them takes the better part of your morning. Istanbul claimed the top spot on INRIX’s 2025 Global Traffic Scorecard for the second year running, with drivers losing a jaw-dropping 118 hours in congestion.
That is a 12 percent jump from the previous year, and nobody is celebrating.
More than 15 million residents are split between the European and Asian sides of the city. The Bosphorus Strait connects them, but only a handful of bridges and tunnels carry that enormous volume of vehicles.
When those crossings back up, the ripple effect spreads across the entire metropolitan area fast.
During the morning peak, central traffic crawled at roughly 13 mph. To put that in perspective, a moderately fit cyclist could almost keep up.
Istanbul’s geography is simply not built for the number of cars trying to use it, and until new infrastructure catches up with population growth, commuters here will keep losing hours they will never get back.
Mexico City, Mexico
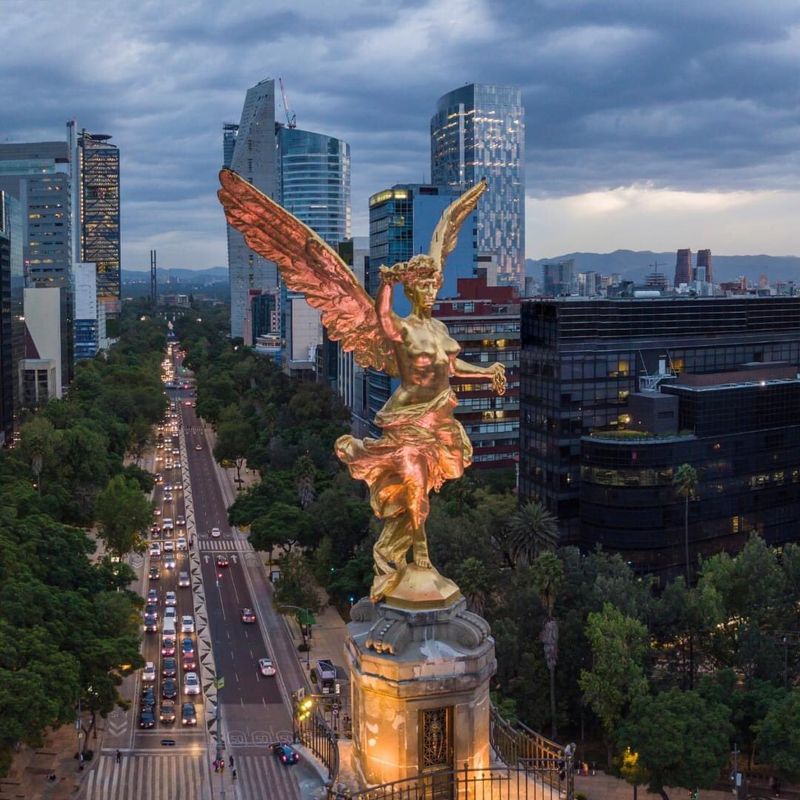
Few cities on Earth can match Mexico City when it comes to sheer, overwhelming scale. With a massive metropolitan population, enormous commuting distances, and dense development packed into every corner, the city shot up to second place in INRIX’s 2025 global rankings.
Drivers lost approximately 108 hours in traffic, an 11 percent increase from 2024.
Downtown speeds during busy morning periods averaged just 11 mph. The city does have an extensive metro and bus rapid transit network, but the sheer number of people needing to move each day means bottlenecks form regularly on major routes connecting outer neighborhoods to employment centers.
One tricky factor is the topography. Mexico City sits in a high-altitude basin surrounded by mountains, which limits how roads can be built and expanded.
Air quality suffers as a result of all that idling traffic too, giving residents yet another reason to dread the daily commute. Efforts to improve public transport are ongoing, but with a population this large and a road network this stretched, meaningful change takes considerable time and investment to show results.
Chicago, Illinois
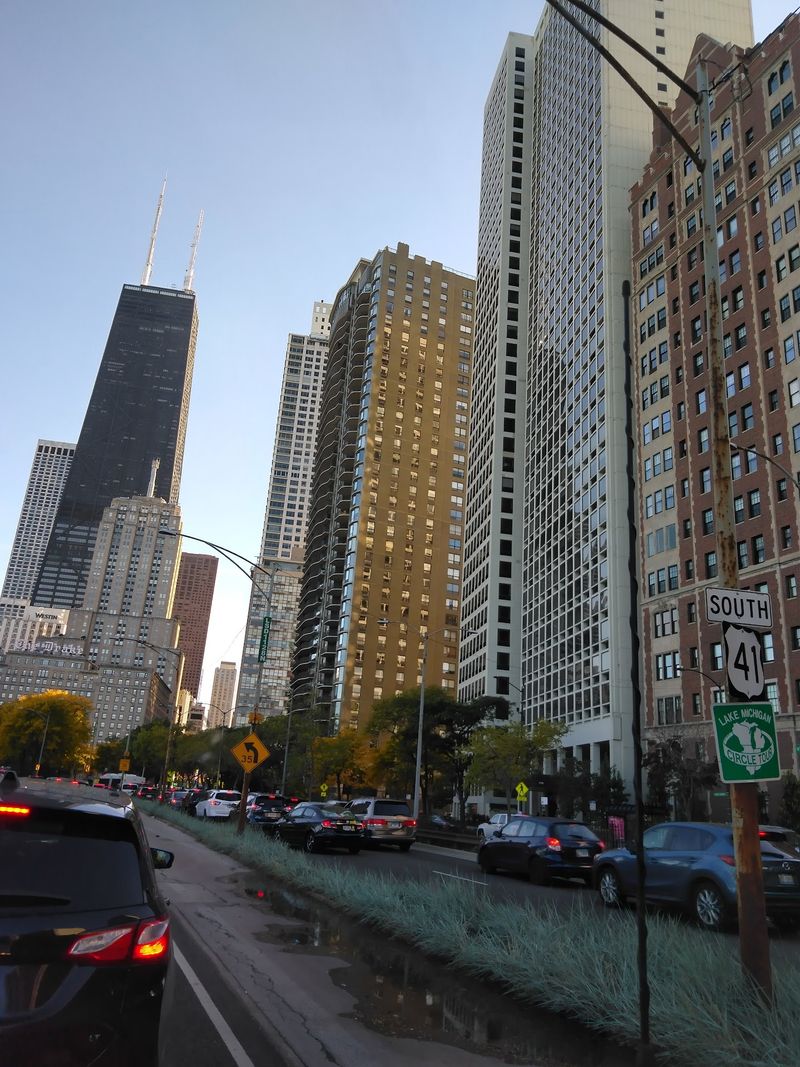
Chicago earned a dubious honor in 2025, becoming the most congested urban area in the entire United States and third on the global list. Drivers lost 112 hours in traffic, a 10 percent increase from the year before.
That is not a small number. That is nearly five full days of sitting behind the wheel going nowhere fast.
What makes Chicago especially painful is the downtown speed figure. Central traffic averaged only 9 mph during the morning peak, the lowest central speed among the entire global top 15.
A brisk walk would genuinely get you there faster in some cases.
Major expressways funnel suburban commuters and freight trucks toward the city center from every direction. Add construction zones, winter weather, the occasional crash, and a limited number of alternative routes, and delays can cascade across the whole region within minutes.
Chicago’s road network carries an enormous load of both passenger and commercial traffic, and that pressure shows up clearly every single weekday morning. The city is actively working on infrastructure upgrades, but the challenge is enormous given the scale of demand.
New York City, New York
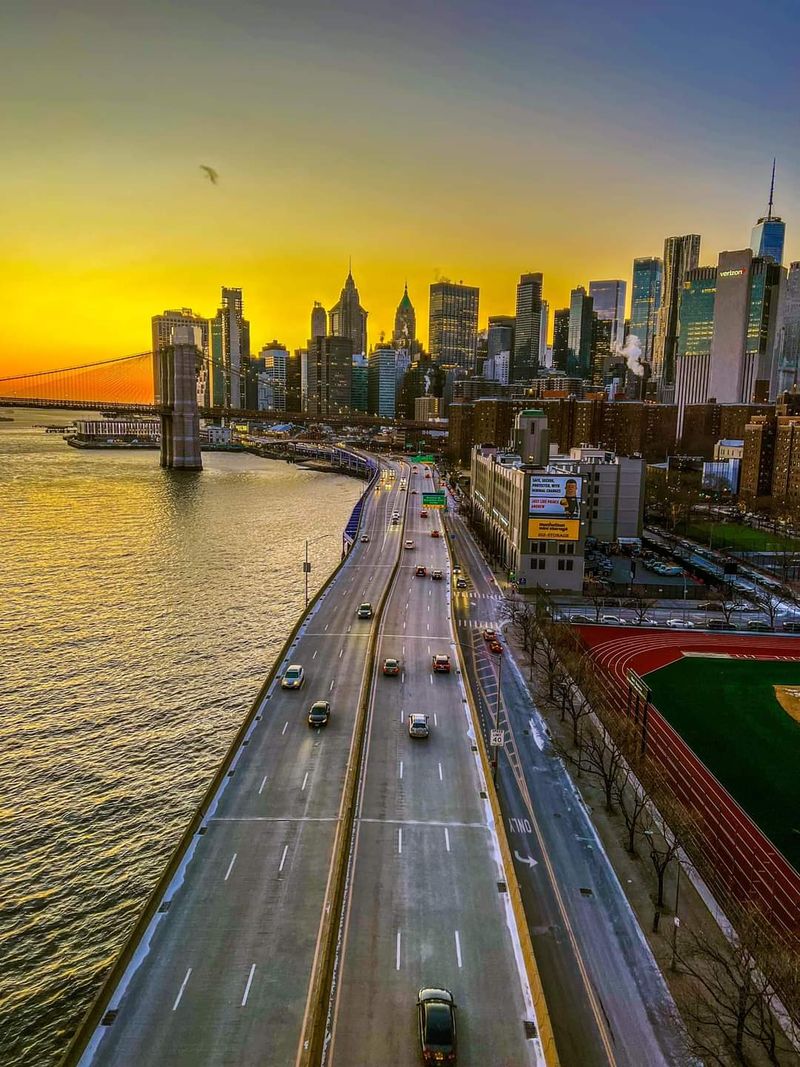
New York City traffic is the stuff of legend, and not in a good way. The city ranked fourth globally in 2025, with drivers losing an estimated 102 hours during the year.
Remarkably, that number held steady from 2024, which is either a sign of progress or proof that things simply cannot get much worse.
INRIX noted something interesting: congestion pricing, introduced to reduce vehicle demand in the central business district, may have started shifting travel patterns. Only one New York road appeared among the report’s 25 busiest U.S. corridors in 2025, compared with five the previous year.
That is a meaningful shift worth watching closely.
Still, New York remains one of the most congested places on the planet. The sheer density of the city, combined with delivery vehicles, construction, taxis, rideshares, and millions of daily commuters, keeps the streets perpetually busy.
Public transit is extensive but aging, and many outer-borough residents still depend on cars. Whether congestion pricing delivers long-term relief remains to be seen, but the early data hints at some real, measurable impact on how people choose to travel.
Philadelphia, Pennsylvania
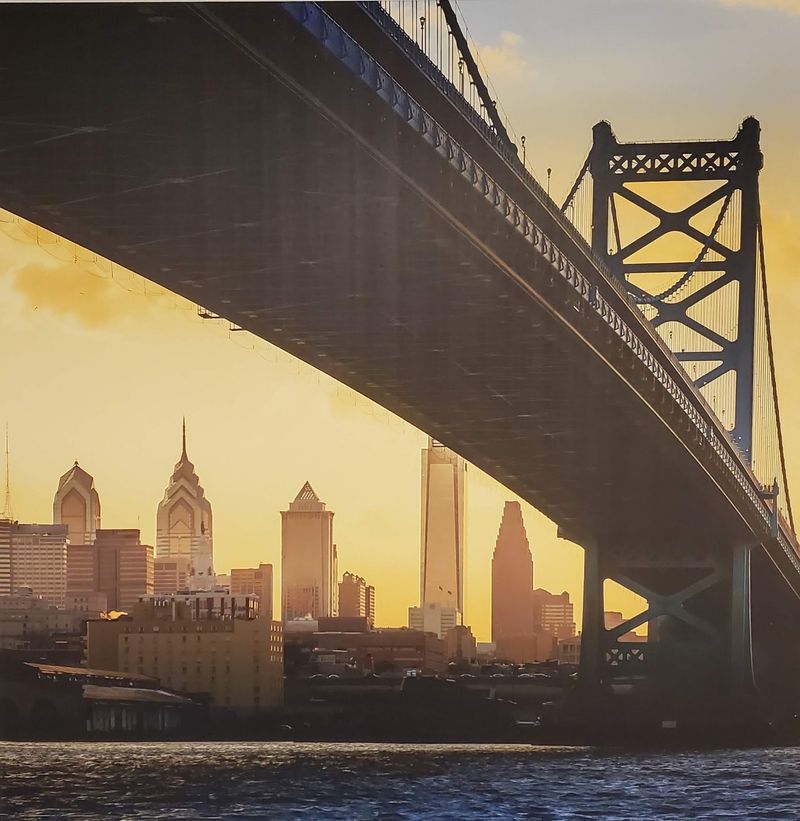
Philadelphia pulled off one of the most dramatic moves in the 2025 rankings, jumping from 13th place all the way to fifth. That kind of leap does not happen without a significant worsening of conditions on the ground, and the numbers confirm exactly that.
Drivers lost 101 hours in traffic, a staggering 31 percent increase from 2024.
No other city in the global top 15 saw congestion grow that fast in a single year. Central speeds during the morning peak averaged only 10 mph, making Philadelphia one of the slowest cities for downtown driving anywhere in the world.
The region’s road network is older and less flexible than many comparable cities. Major interstate corridors cut through the area, carrying both commuter traffic and heavy freight between the Northeast’s biggest urban centers.
Several key bridges and tunnels also act as chokepoints, especially during peak hours. Add in construction activity and growing suburban populations pushing more cars onto already strained routes, and the recipe for serious congestion is complete.
Philadelphia’s rise up this list should serve as a wake-up call for city planners and transportation officials.
Cape Town, South Africa
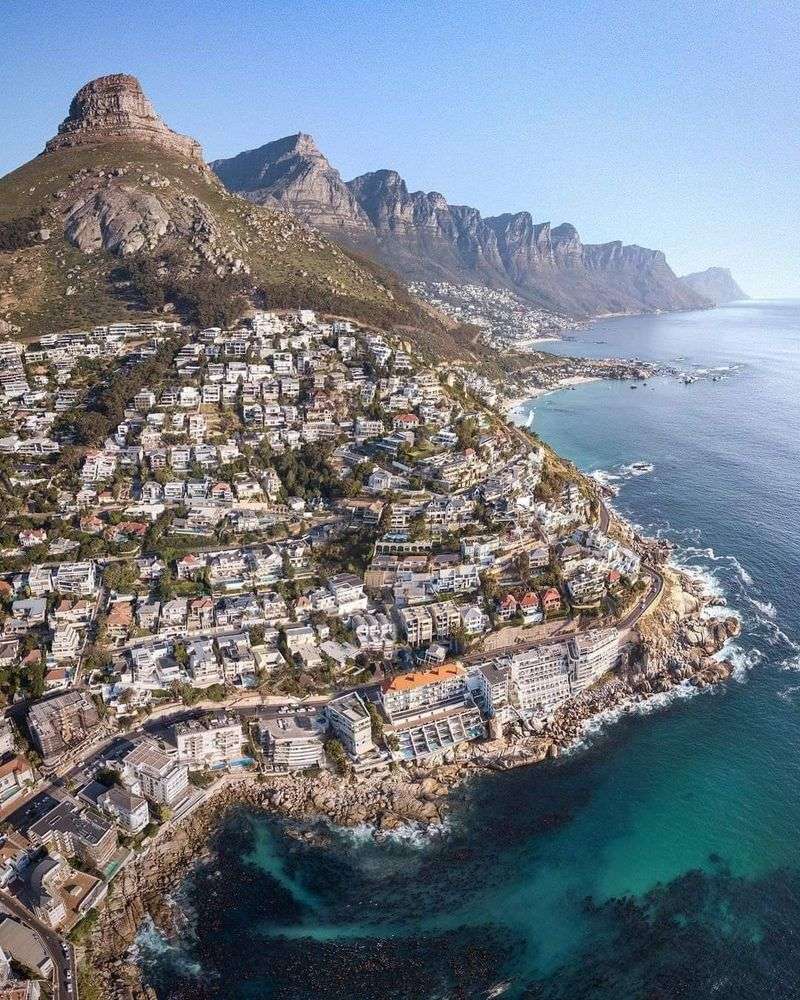
Cape Town is one of the most visually stunning cities in the world, but its geography that makes it so beautiful is also what makes driving there such a headache. Mountains, coastline, and nature reserves create natural barriers that funnel all traffic onto a surprisingly small number of roads.
Drivers lost approximately 96 hours in 2025, with delays up 2 percent from the previous year.
Downtown speeds averaged around 11 mph during peak periods. The real pressure comes from commuters traveling long distances from the Cape Flats and surrounding suburbs into central employment areas.
Many of these residents have limited access to reliable public transport, making the car their only practical option.
The arterial roads connecting outer communities to the city center simply were not designed to carry this level of demand. Road expansion is difficult when mountains and ocean limit where new routes can go.
Cape Town ranked sixth globally, which is a striking position for a city of its size. Investment in public transport, particularly rail and bus rapid transit, is gradually improving, but the structural geographic challenges here will never fully disappear no matter how much infrastructure spending is committed.
London, United Kingdom
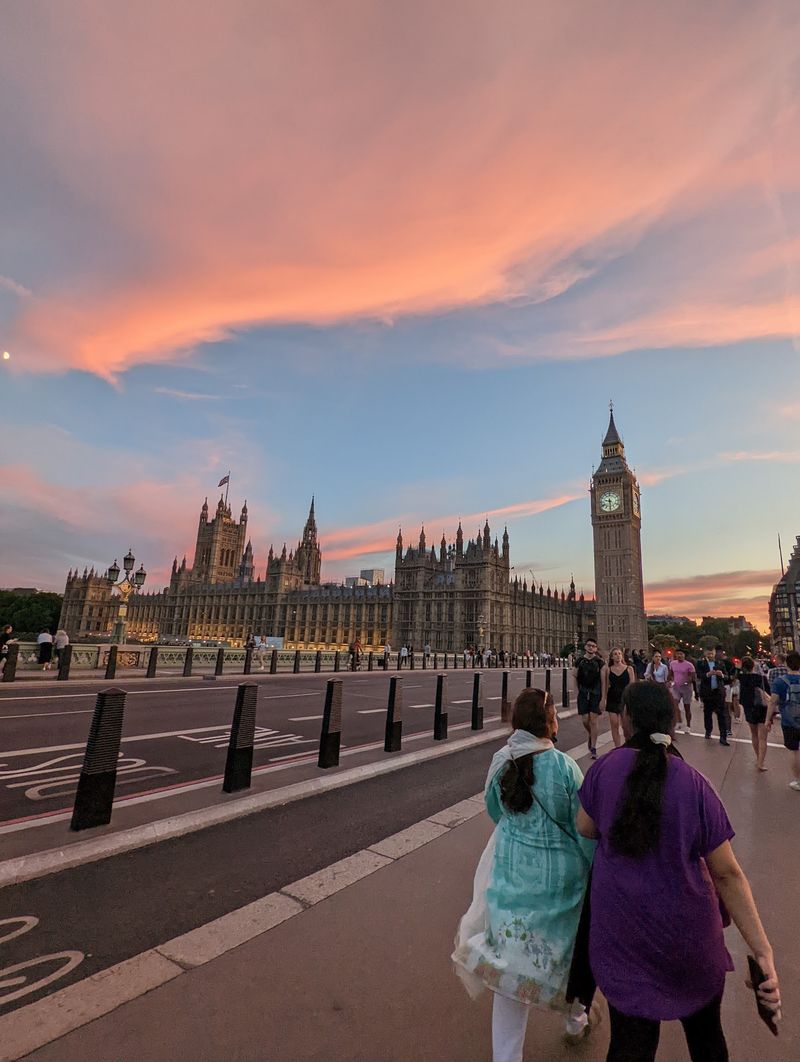
London’s streets were laid out centuries before the automobile existed, and it shows. The city ranked seventh globally in 2025, though drivers actually lost fewer hours than before, with 91 hours recorded, down 10 percent from 2024.
That improvement is real, but London still sits firmly among the world’s worst cities for road congestion.
Central traffic averaged around 11 mph during peak periods. The dense historic street network was never designed for modern traffic volumes, and every delivery van, bus, taxi, and rideshare vehicle competing for the same narrow lanes makes progress painfully slow.
Roadworks seem to appear on every other block at any given time.
London’s extensive public transport system, including the Underground, Overground, buses, and Elizabeth line, genuinely helps absorb millions of daily trips. Without it, the situation would be catastrophic.
The city’s congestion charge zone has also helped reduce central vehicle numbers over the years. Still, for anyone who must drive through central London during rush hour, the experience remains genuinely frustrating.
The combination of narrow roads, high demand, and constant activity means even small incidents can trigger significant delays across a wide area.
Paris, France
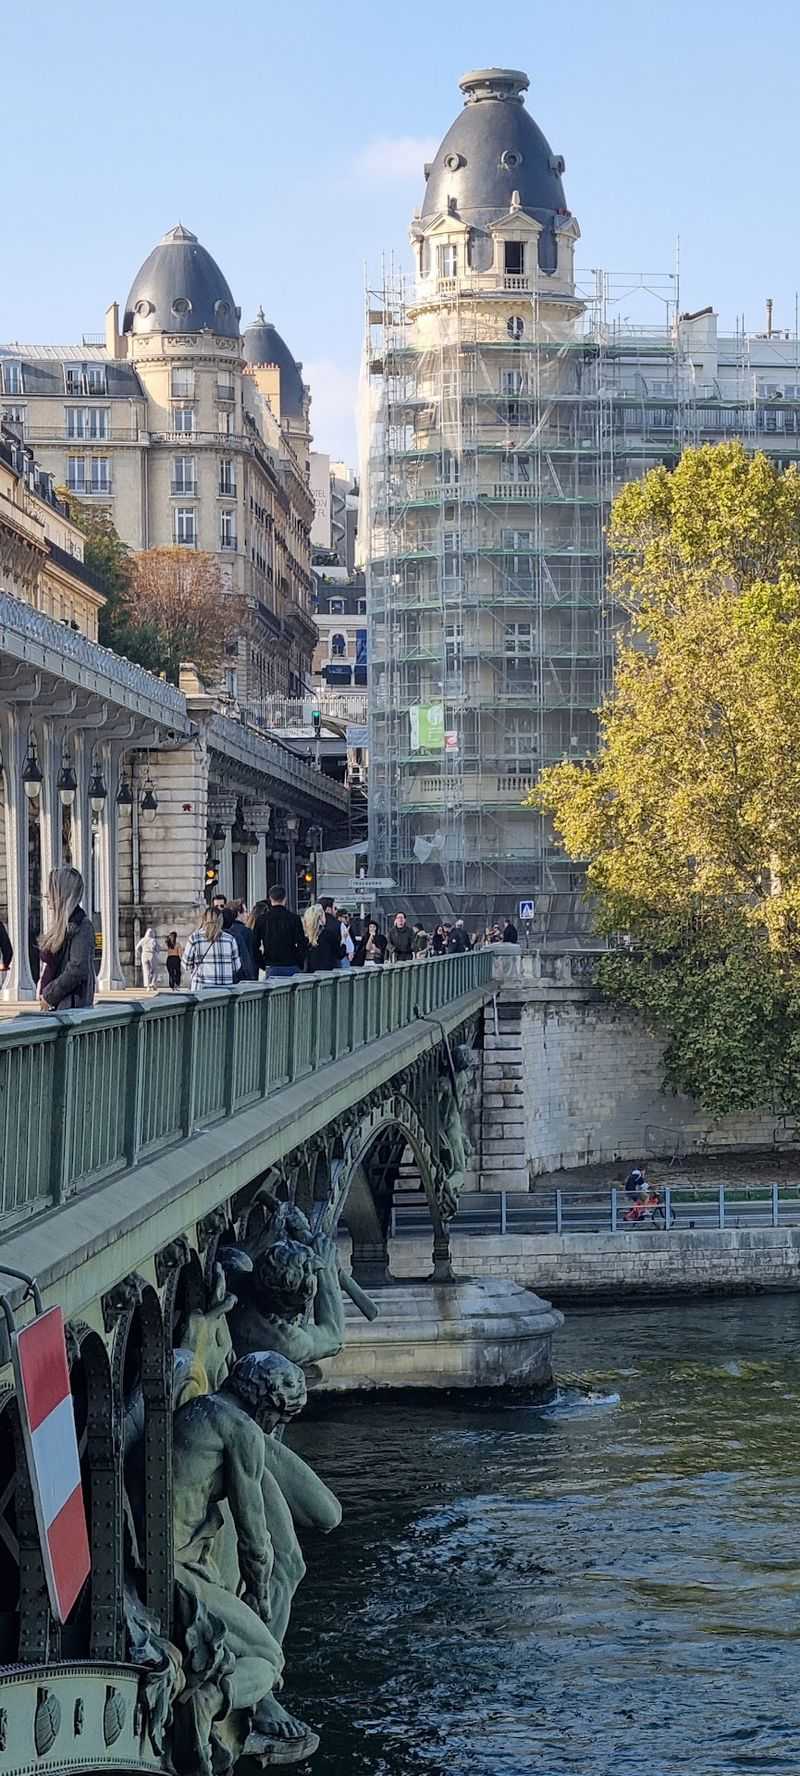
Paris recorded 90 hours lost in 2025, a 7 percent improvement from the previous year, but the French capital still ranked eighth globally. The city has been deliberately redesigning its streets over recent years, removing lanes from some roads to make room for bike paths and pedestrian zones.
The policy is popular with cyclists and walkers, but it does concentrate remaining vehicle traffic more intensely.
Downtown morning speeds averaged approximately 11 mph. Major routes like the Boulevard Peripherique, the ring road that circles the city, regularly fill to capacity during commuting hours.
Traffic from the sprawling suburbs feeding into Paris through a limited number of entry points adds to the pressure.
Paris has one of the best metro systems in the world, and the city actively encourages its residents to use it. Bike-share programs have also grown significantly, giving people genuine alternatives to driving.
However, many suburban commuters simply do not have practical access to rail or metro connections close to their homes or workplaces. For them, the car remains the only real option, which keeps road demand stubbornly high even as the city works to reshape itself around cleaner, quieter forms of movement.
Jakarta, Indonesia
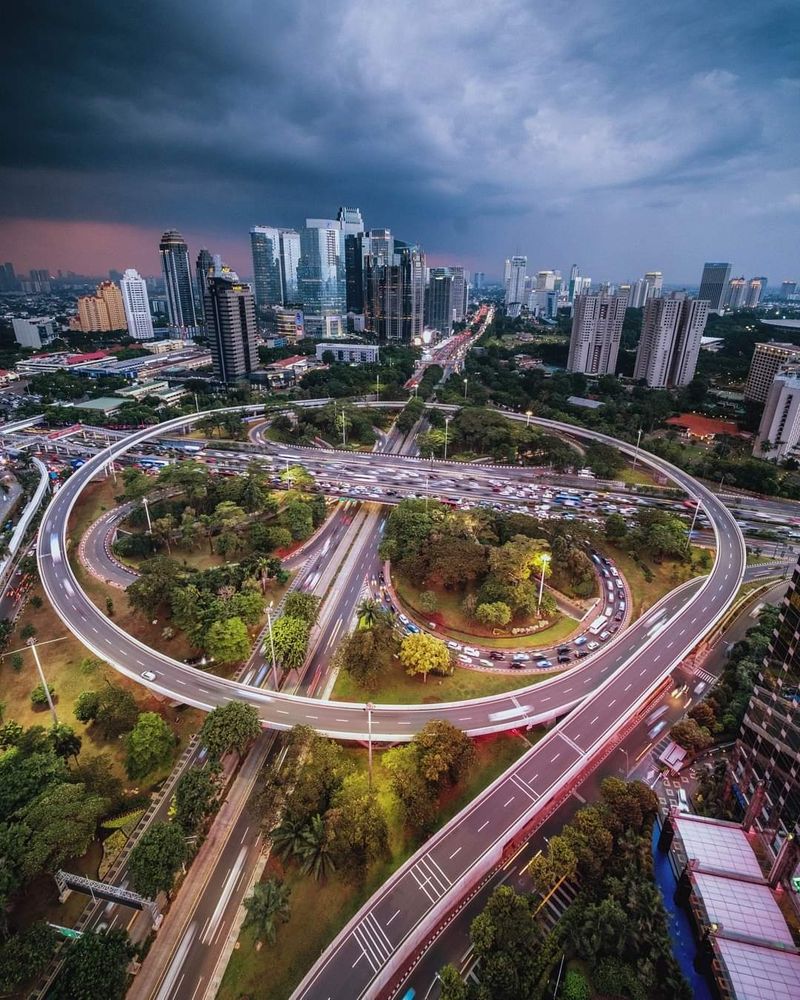
Jakarta has been synonymous with terrible traffic for decades, and 2025 was no exception. The city ranked ninth globally, with drivers losing approximately 83 hours in congestion.
Delays did fall by 7 percent, which is encouraging, but Jakarta remains one of the toughest places in Asia for anyone trying to move through it by road.
The scale of the challenge here is hard to overstate. Rapid metropolitan growth, enormous volumes of motorcycles and cars, frequent flooding during the rainy season, and development sprawling across a vast urban footprint all combine to create persistent gridlock.
When flooding hits, roads that are already slow become completely impassable.
New rail and bus rapid transit services have expanded travel options for many residents, and ridership has grown steadily. Still, the city’s sheer size and the gap between where people live and where they work mean that roads carry enormous demand every single day.
Jakarta is also dealing with land subsidence, which complicates infrastructure investment. The Indonesian government has been investing heavily in transport improvements, and progress is visible, but closing the gap between the city’s transportation needs and its current capacity will take many more years of sustained effort.
Los Angeles, California
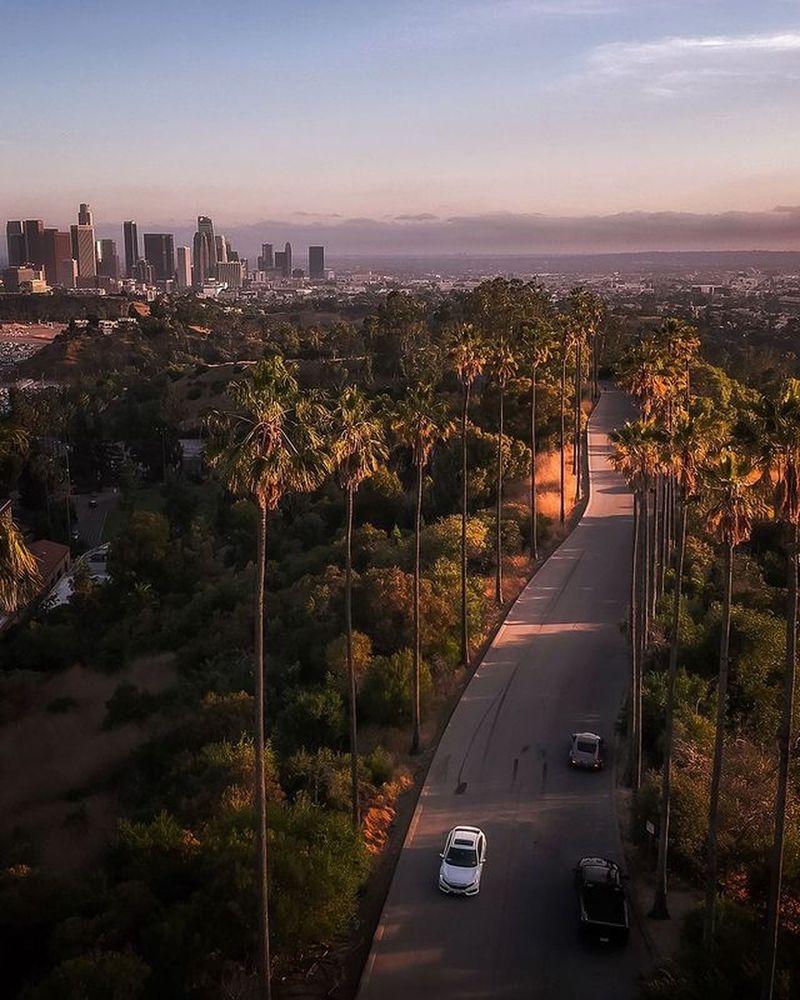
Los Angeles and traffic jams go together like sunshine and sunscreen. The city ranked 10th globally in 2025, with drivers losing an estimated 87 hours, a very slight 1 percent decline from 2024.
Central traffic moved at 17 mph, which is actually faster than most cities near the top of this list, but that number tells only part of the story.
The real issue in Los Angeles is not one slow downtown core but rather the enormous geographic spread of the entire region. Jobs, homes, airports, ports, beaches, and entertainment venues are scattered across hundreds of square miles.
That spread forces millions of residents onto heavily traveled freeways for journeys that have no realistic transit alternative.
The 405, the 101, the 10 – these freeways are practically cultural institutions at this point, famous for their capacity to turn a 20-minute trip into a 90-minute ordeal. Public transport investment has grown, and Metro rail lines now reach more of the region than ever before.
Even so, car ownership and freeway dependence remain deeply embedded in Southern California life. Changing that will require generations of infrastructure investment and genuine shifts in how the region develops.
Dublin, Ireland
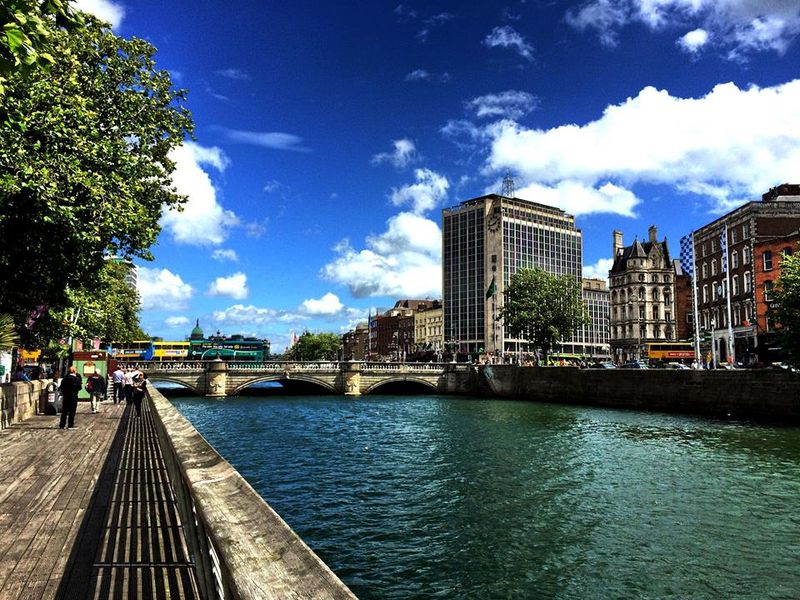
Dublin jumped four places in the 2025 rankings, landing at 11th globally after congestion worsened sharply over the previous year. Drivers lost approximately 95 hours, a 17 percent increase from 2024.
For a relatively compact city, those numbers are genuinely alarming and reflect how quickly a fast-growing urban area can outpace its infrastructure.
Dublin’s historic city center is dense and tightly constrained, with the River Liffey limiting north-south crossings to a handful of bridges. Rapid suburban expansion over the past decade has pushed more commuters onto routes that were not built to handle this level of demand.
The result is predictable bottlenecks that start early and last well into mid-morning.
Buses get caught in the same general traffic as private cars on many routes, which undermines their reliability and makes them a frustrating option for commuters trying to plan their days. Priority bus corridors exist but are not continuous across the whole network.
Dublin is investing in light rail expansion and additional bus infrastructure, and those projects will eventually help. For now, though, the city is in a difficult middle phase where population and car ownership have grown faster than the transport alternatives needed to manage them.
Boston, Massachusetts
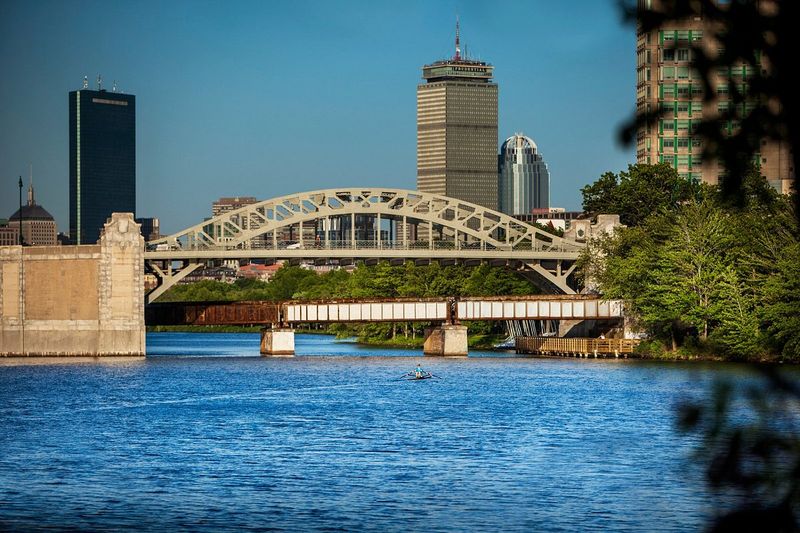
Boston’s street layout has confused visitors for centuries, and it causes daily headaches for the people who drive it every day. The city ranked 12th globally and fifth in the United States in 2025, with drivers losing 83 hours in traffic, a 5 percent increase from the previous year.
Downtown speeds during the morning peak averaged approximately 10 mph.
The city’s irregular street pattern was famously laid out along old colonial paths rather than any logical grid. That history creates a labyrinth of one-way streets, unexpected dead ends, and intersections that seem designed to generate confusion.
Combined with limited river crossings and several aging tunnels, movement through the city can feel genuinely unpredictable.
Boston also hosts an extraordinary concentration of universities, hospitals, research institutions, and major employers within a relatively small geographic area. That means enormous numbers of people are all trying to reach similar destinations at similar times each day.
The MBTA subway and bus system helps, but service reliability issues have frustrated riders for years. Major infrastructure projects, including ongoing work on key tunnels and bridges, regularly create additional short-term disruptions.
Boston’s congestion problem is as much about its remarkable density of activity as it is about road capacity.
Bangkok, Thailand
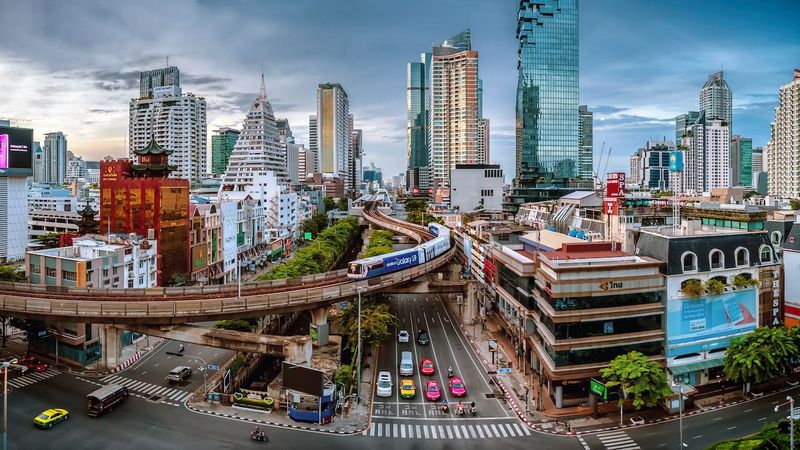
Bangkok has been battling epic traffic for so long that it has practically become part of the city’s identity. The Thai capital ranked 13th globally in 2025, with drivers losing an estimated 76 hours in congestion.
Delays crept up by 3 percent, and downtown morning traffic averaged about 12 mph, a figure that understates just how chaotic some intersections can get.
The city is a fascinating tangle of expressways, canals, elevated rail lines, and ground-level roads all layered on top of each other. Motorcycles weave between lanes constantly.
Buses, taxis, tuk-tuks, and private cars all compete for the same space. The result is a kind of organized chaos that somehow keeps moving, but slowly.
Bangkok’s rail network has expanded significantly over the past decade, with BTS Skytrain, MRT subway, and Airport Rail Link all serving different parts of the city. Ridership has grown, and for journeys along rail corridors, the difference in travel time compared to driving is dramatic.
The challenge remains last-mile connectivity and the continued growth of outer suburban areas without adequate transit access. Bangkok is improving, but the pace of urban growth keeps the pressure on roads from easing too quickly.
Brisbane, Australia
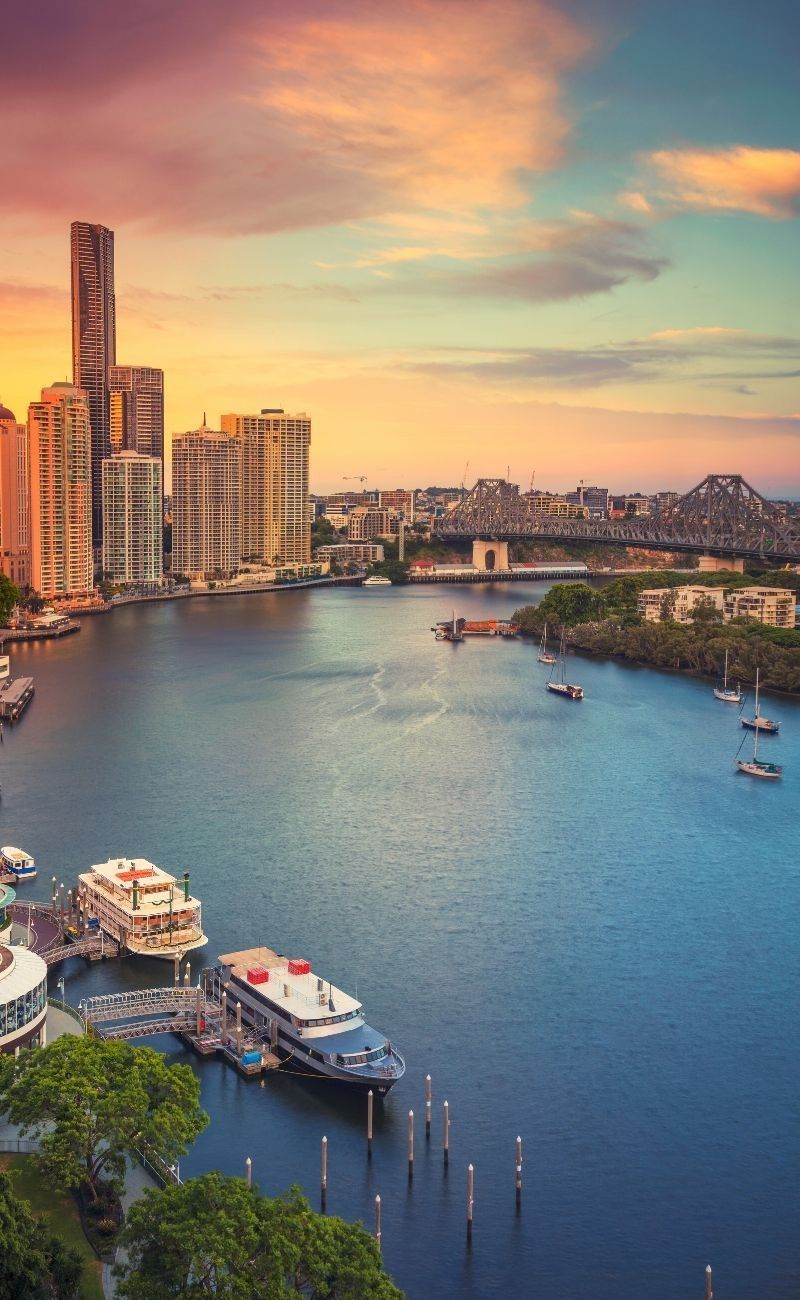
Brisbane might surprise some people by appearing in a global top 15 list for traffic congestion, but the numbers are real. The city ranked 14th in INRIX’s 2025 Impact Rank, with drivers losing approximately 81 hours, though that figure actually improved by 4 percent from the previous year.
One standout stat: Brisbane’s central speed of 18 mph was the fastest among the entire global top 15.
That higher central speed reflects a different kind of congestion problem. Brisbane’s delays are less about a painfully slow downtown core and more about the pressure on specific corridors connecting rapidly growing outer suburbs to the city center.
The Brisbane River, winding through the urban area, limits how many bridges can practically be built, creating natural chokepoints.
Communities to the north, south, and west of Brisbane have grown dramatically over the past decade as people moved to Southeast Queensland for affordability and lifestyle. That growth has outpaced road and rail infrastructure in many corridors.
The Cross River Rail project, currently under construction, is expected to significantly improve capacity when it opens. In the meantime, peak-hour commuters on certain routes are experiencing the kind of delays that have long been associated with much larger cities.
Miami, Florida
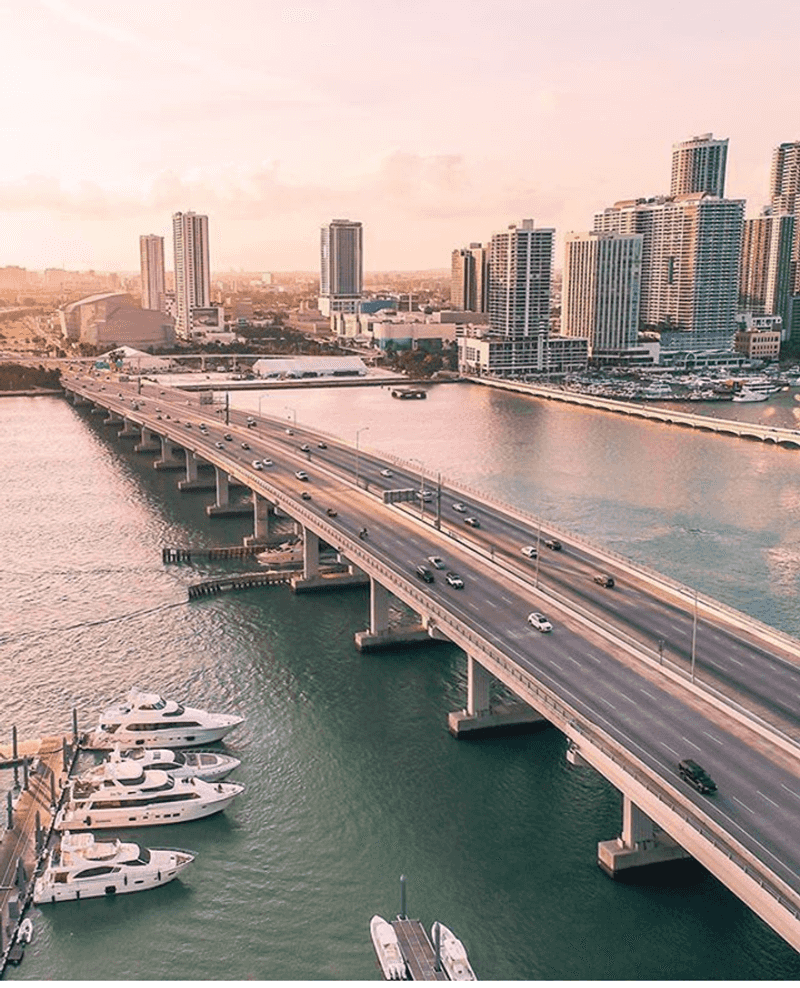
Miami closes out the global top 15 with a congestion story shaped largely by geography. The region is essentially a long, narrow strip of urban development squeezed between the Atlantic Ocean to the east and the Everglades to the west.
There is simply not much room to build new roads, and the ones that exist carry an enormous amount of daily traffic. Drivers lost around 75 hours in 2025, with delays edging slightly higher than the previous year.
Central traffic averaged approximately 14 mph during the morning peak. A handful of north-south highways, particularly Interstate 95 and US-1, carry the bulk of commuter and commercial traffic through the region.
When anything goes wrong on those routes, whether a crash, flooding, or a major event, the entire system feels the impact.
Tourism adds a layer of unpredictability that other cities on this list do not deal with quite as heavily. Seasonal visitor surges, cruise ship schedules, and major events like Art Basel or the Formula 1 Grand Prix can dramatically change traffic patterns almost overnight.
Population growth continues at a rapid pace too, adding more vehicles to roads that were already stretched. Miami’s congestion challenge is real, growing, and closely tied to its own success as a destination.
Share this story