Fresh air is something most of us never think about until it gets smoky or dusty. Some capital cities breathe easier than others, and the numbers prove it.
Using IQAir’s 2025 data on fine airborne particles called PM2.5, this list shows 15 capitals with some of the lowest yearly averages. Ready to find out where the air is cleanest?
Panama City, Panama
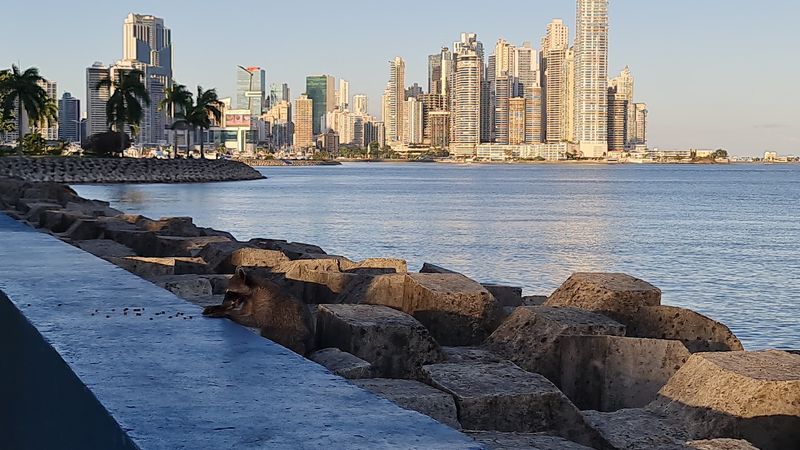
Skyscrapers, a giant canal and traffic jams all fit in Panama City. Yet the air still scored just 3.3 micrograms per cubic meter of PM2.5 in 2025.
That sits comfortably under the WHO guideline of 5.
Few major urban centers can say the same. Many big cities across the world stay far above that line, and some capitals in the same dataset averaged more than ten times Panama City’s level.
Of course, an annual average is not a promise for every single day. Traffic, construction, fires and regional pollution can all cause short bumps.
A busy rush hour on the avenue can still feel stuffy.
But over twelve months, the city came out looking great. Ocean breezes and a tropical climate may give the air a regular refresh.
Walking along the Cinta Costera, with the bay on one side and towers on the other, you are breathing some of the cleanest capital air around. A glass skyline and healthy lungs make a nice combination, and the numbers back it up.
Reykjavík, Iceland
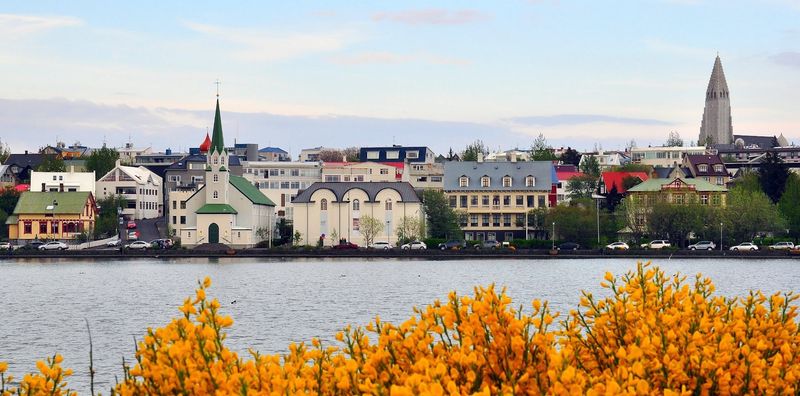
Picture a city where the biggest air problem is sometimes road dust. That is Reykjavík.
Its 2025 PM2.5 average was 3.4 micrograms per cubic meter, well inside the WHO guideline.
Iceland as a whole averaged 3.7, so the whole country is doing well. The capital has tracked its air since 1990, and local officials say the quality is generally good.
Dry and calm days can still kick up dust and push PM10 numbers sharply higher. When that happens, the city may use dust suppression and send public warnings.
It shows that a low yearly average does not mean zero bad days.
Even so, the big picture is lovely. Cold Atlantic winds move through often, and homes are largely warmed by geothermal energy, not smoky fuel.
That helps keep the sky clear. A walk up to the tall church tower gives wide views of bright rooftops and mountains with very little haze.
Few places combine hot springs and crisp air so neatly, and Reykjavík manages both with ease.
Bridgetown, Barbados
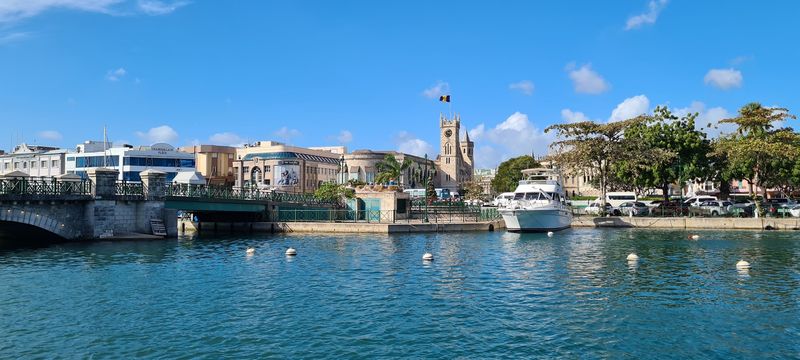
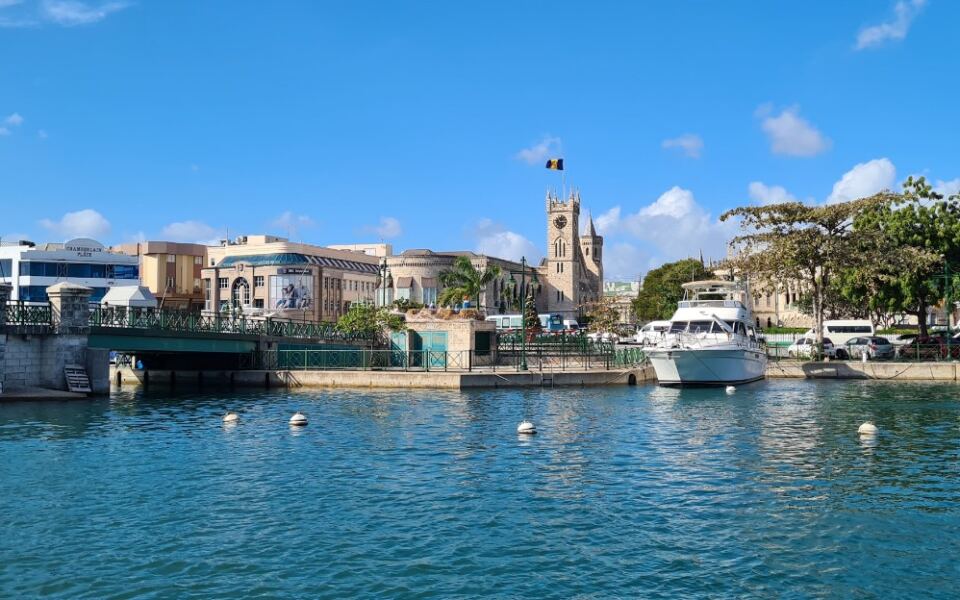
Here is a number that sounds almost too good: 2.6 micrograms per cubic meter. That was Bridgetown’s 2025 PM2.5 average, the lowest among sovereign capitals in the IQAir table.
It is about half of what the World Health Organization recommends for a year.
Barbados runs air sensors at several spots, including the Treasury Building in the city. They track PM2.5, PM10, nitrogen dioxide and ozone.
That is a lot of watching for an island known for beaches and rum punch.
There is a small catch. The Environmental Protection Department says its low-cost equipment gives indicative results, not official regulatory-grade ones.
So the figure is a strong sign of clean air, but not the final word.
Still, a result this tiny deserves a cheer. Trade winds blowing across the Atlantic likely help sweep the island clean.
Visitors strolling the harbor can enjoy breezy days knowing the particle count is remarkably low. Not many capitals can claim a number like that, and Bridgetown wears the crown proudly.
Pack sunscreen, not a mask, and enjoy the salty breeze coming off the sea.
Canberra, Australia
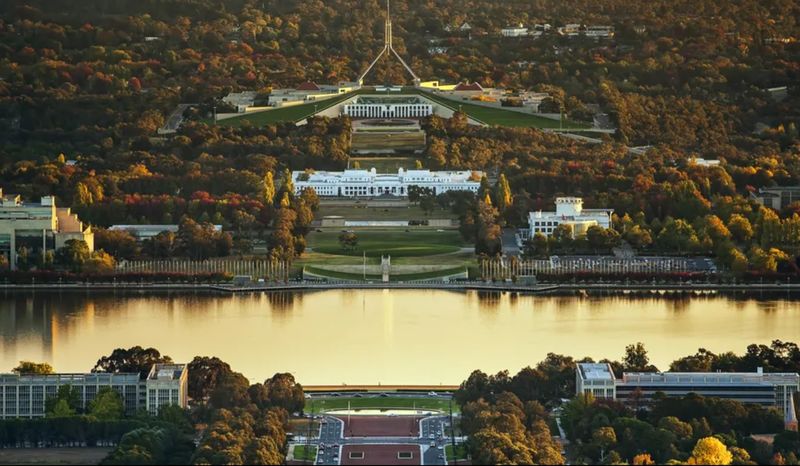
Canberra just grabbed a title: IQAir named it the cleanest major city in the world for 2025. Its PM2.5 average was 3.6 micrograms per cubic meter.
Not bad for a capital built around a lake.
The city has been steady, too. It scored 3.9 in 2024 and 3.8 in 2023.
Yet the catastrophic 2019 to 2020 bushfire season showed how fast things can flip when smoke rolls in.
Winter brings another issue. The ACT Government says wood heaters are the main source of local winter pollution.
It regulates heater emissions and offers programs to encourage cleaner ways to stay warm.
So Canberra pairs great numbers with real effort. Wide streets, lots of trees and plenty of parkland help the city breathe.
Cyclists loop around Lake Burley Griffin with little more than fresh air in their faces. If you like your capitals calm, green and quietly proud, this one fits the bill nicely.
A crisp morning there feels almost too clean to be true.
Wellington, New Zealand
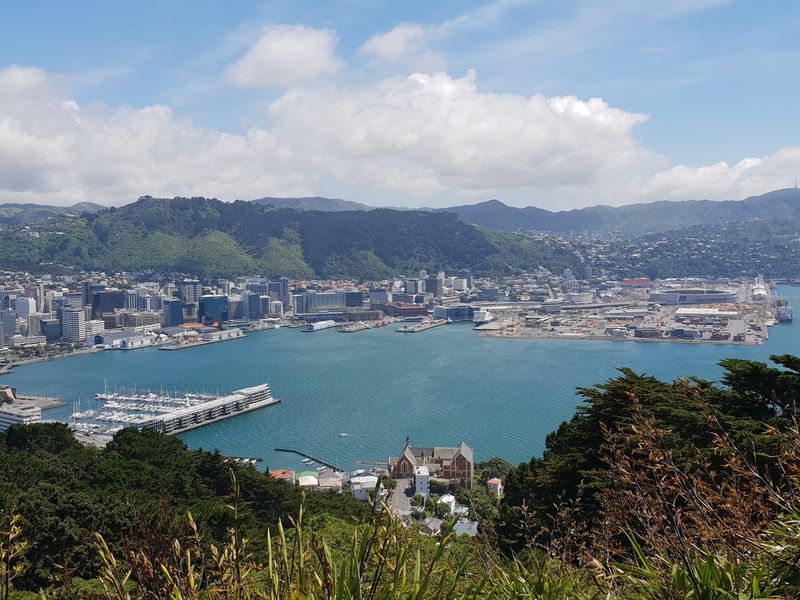
Wellington is famous for wind, and the air stats might be thanking it. The city held a 2025 PM2.5 average of 4.3 micrograms per cubic meter, the same as the year before.
That keeps it below the WHO guideline.
Greater Wellington Regional Council watches pollutants tied to traffic and home heating. It has also released a 2026 technical report on air trends through 2025.
That is a lot of paperwork for something you cannot see.
Officials point out a few troublemakers. Older diesel vehicles can raise pollution along busy roads.
Inefficient wood burners can add fine particles in winter in parts of the wider region.
That is why the low figure matters. The sources exist, but the city still stays clean overall.
Weather and monitoring locations shape how much people are exposed at different times. Walk the waterfront on a gusty day and you will feel it: the air is moving, refreshing and in no hurry to hang around.
Hold onto your hat, and enjoy the clean air.
Tallinn, Estonia
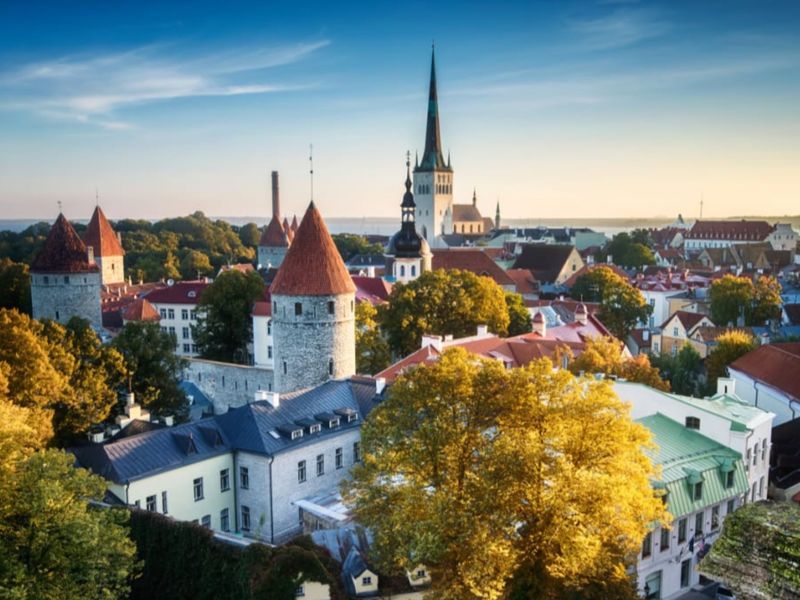
Medieval towers and modern air sensors share the same skyline in Tallinn. The Estonian capital averaged 4.5 micrograms per cubic meter of PM2.5 in 2025.
Estonia as a country came in at 4.9, so both are below the WHO guideline.
What makes the data interesting is where it is collected. Tallinn keeps three stations in the national network, each in a different setting. Õismäe covers a high-rise neighborhood, Rahu watches urban air in the north, and Kesklinna sits in a busy central area.
That spread matters because air can differ a lot from street to street. One corner may be calm while another is full of exhaust.
Measuring both gives a fairer picture.
So when Tallinn reports a low average, it counts for more. The numbers come from traffic-heavy zones as well as quieter homes.
Wander the cobbled Old Town and you will smell pastries and sea air, not smog. A clean breeze off the Baltic helps, and the city seems to know its good fortune.
Brasília, Brazil
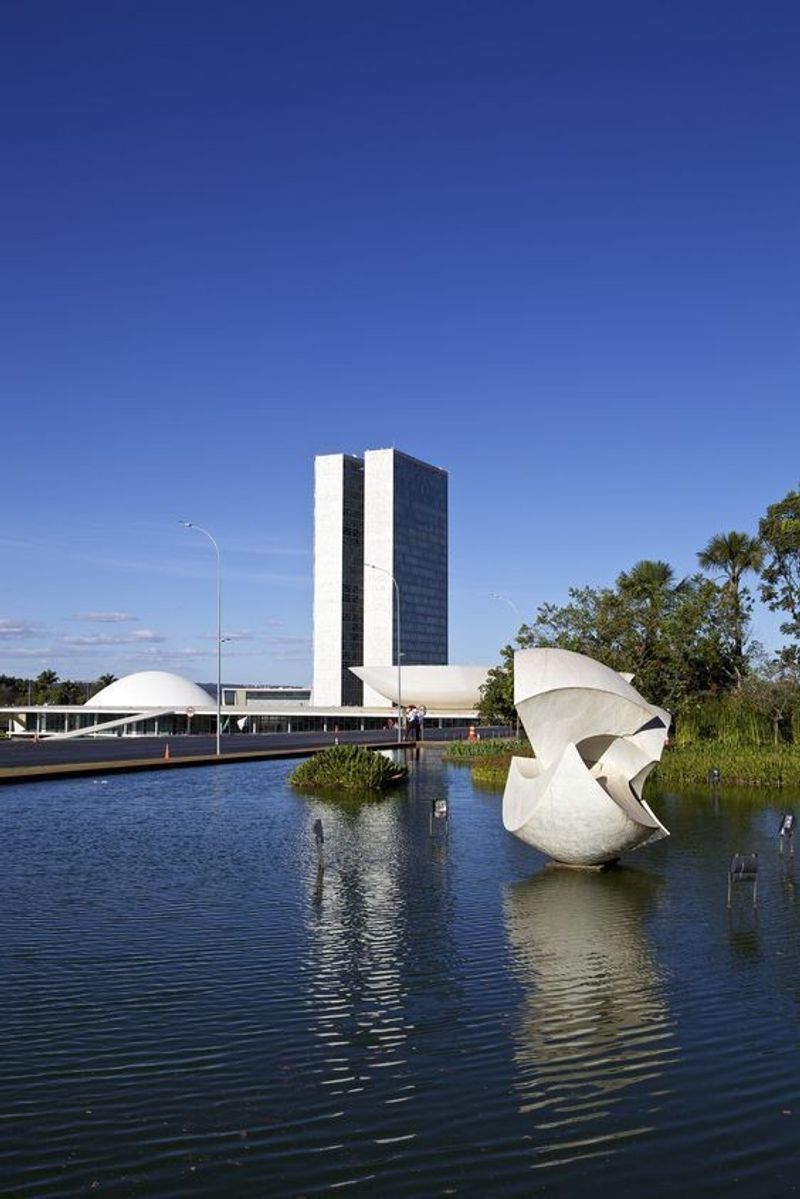
A capital built from scratch on a high plateau, Brasília has a number worth noticing: 4.6 micrograms per cubic meter in 2025. It was the last sovereign capital in IQAir’s ranking to stay under the WHO’s 5 mark.
That sets it apart from many big Latin American cities, where fine particle levels run much higher. Wide avenues and lots of open space may help the air spread out.
Brazil has also made data easier to find. MonitorAr, run by the federal environment ministry, gathers readings from official stations across the country.
Brasília Ambiental adds monthly reports for the Federal District.
Keeping watch matters, even with a low yearly figure. The dry season and fires can change conditions fast.
Anyone visiting in the dry months should check local updates before planning long outdoor walks.
Still, the overall result is a win for a city best known for modern architecture. Standing before those curved white domes under a huge sky, you can take a deep breath and mean it.
Stockholm, Sweden
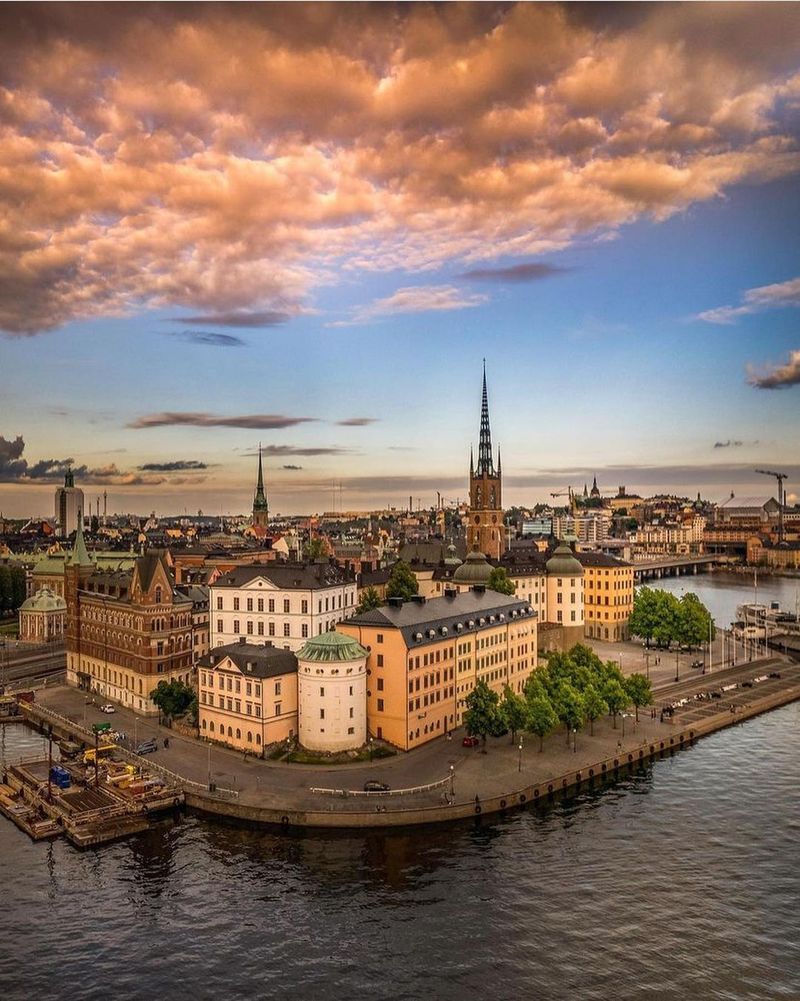
Missing a target by 0.2 is close enough to make you sigh. Stockholm averaged 5.2 micrograms per cubic meter of PM2.5 in 2025, just over the WHO’s 5.
Two decades ago, the numbers were much higher.
City monitoring explains that much of the PM2.5 drifts in from outside Sweden. Long-range air transport carries particles across borders, so local rules cannot fix everything.
Closer to home, road wear creates particles, and so do traffic and energy production. Those sources are steady but manageable.
The long view is the real story. Central Stockholm sites once logged double-digit concentrations in the early 2000s.
Today’s readings show a big improvement, thanks to years of cleaner vehicles and smarter planning.
Take a ferry between the islands and you will notice how fresh the water breeze feels. The city is not perfect, but it has come a long way.
Progress like that deserves applause, and Stockholm earns it every time the sea wind blows through.
Helsinki, Finland
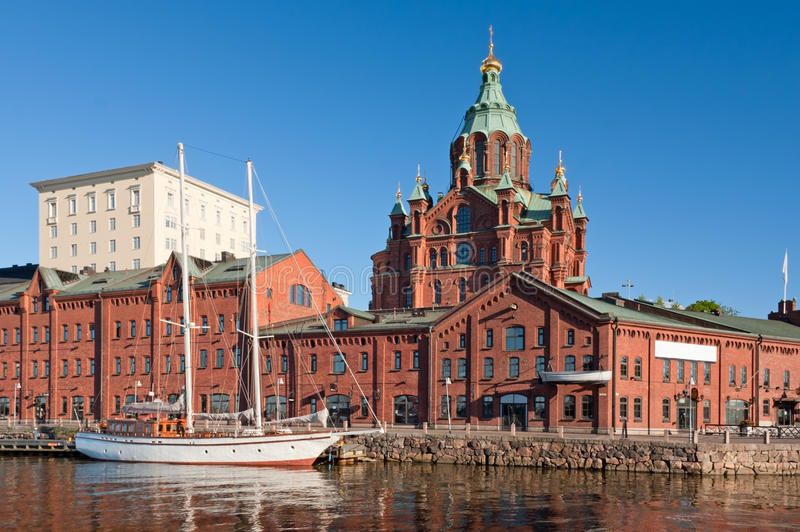
“Fairly good by international standards” is how Helsinki describes its own air. The 2025 PM2.5 average was 5.5 micrograms per cubic meter, just above the WHO line.
Finland overall landed near 5.2.
City leaders are honest about their problems. Street dust, vehicle exhaust and smoke from small wood-burning stoves still cause trouble.
Spring can be especially dusty after the snow melts and sand left on roads gets stirred up.
To tackle it, the city built an Air Quality and Noise Abatement Plan for 2024 to 2029. It holds nearly 40 measures, with a focus on cutting street dust and wood-burning emissions.
That attitude is refreshing. Many places would shrug and say the air is fine.
Helsinki keeps pushing for better, because even low pollution can affect health.
Stand on the steps of the big white cathedral and look out over the square. The air feels crisp, and the city is working to keep it that way.
Clean today, cleaner tomorrow is the plan.
Port of Spain, Trinidad and Tobago
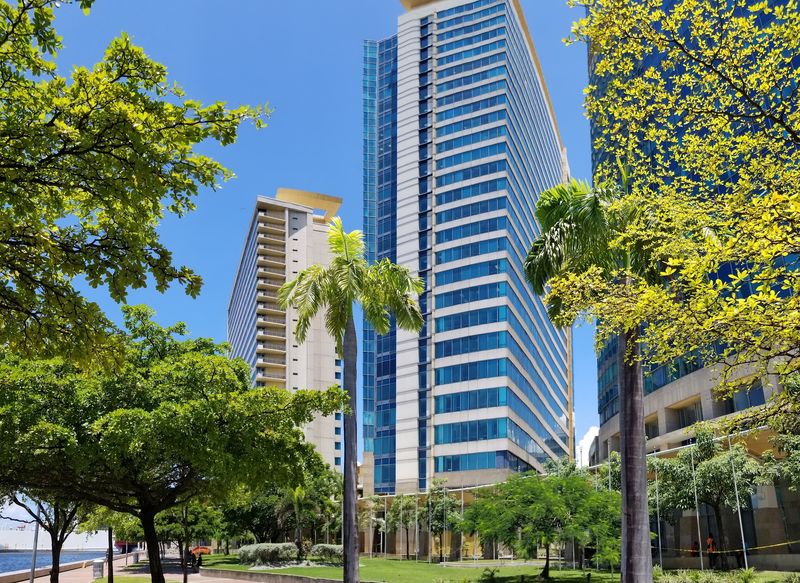
Tie game! Port of Spain matched Helsinki at 5.5 micrograms per cubic meter in the 2025 IQAir capital data.
That puts the Caribbean city only slightly above the WHO guideline.
It is also far below the pollution found in many huge metropolitan areas. That is a nice result for a country with plenty of transport and industry.
The detail matters. A busy economy does not automatically mean the same exposure in every city.
Location, wind and local layout all play a part, and the capital seems to get a good deal from them.
As with every entry on this list, the number is an annual mean from available monitoring. It does not cover every pollutant.
It also does not rule out a rough day when traffic is heavy or the wind drops.
Still, a stroll around the big savannah park, with its food stalls and cricket fans, does not feel smoggy. Sea breezes keep things moving.
Grab a cold coconut water and breathe easy.
Oslo, Norway
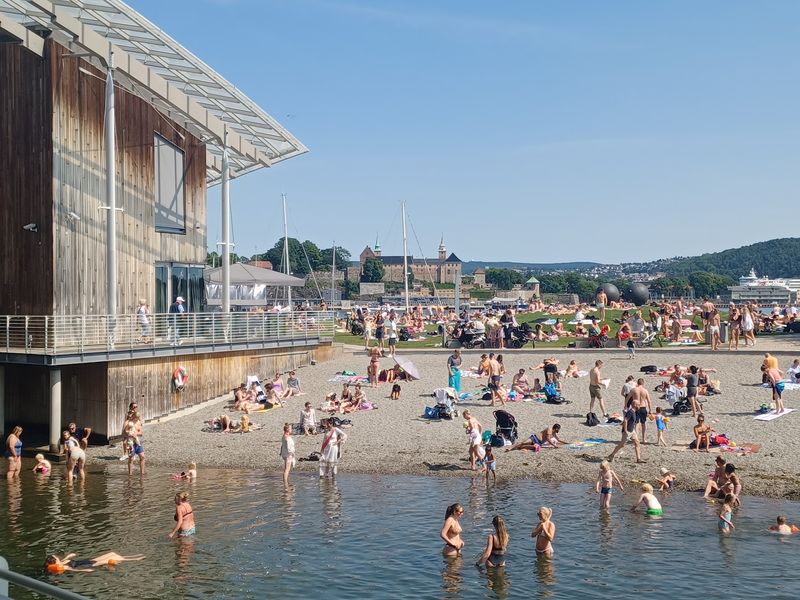
Oslo went from 6.9 in 2024 to 6.0 in 2025. That drop in PM2.5, measured in micrograms per cubic meter, shows the city moving the right way.
The WHO guideline of 5 is now within sight.
City officials say air pollution has fallen a lot over the past 50 years. Local measures get part of the credit.
Nitrogen dioxide has dropped especially well since 2013.
Cleaner vehicles helped, and so did changes in traffic, including congestion charges and environmental tolls. Drivers pay more to enter, and the air benefits.
Winter still brings some bad spells. Cold, low-wind days can trap particles close to the ground, and episodes of particulate pollution can show up.
Even so, the annual result is impressive for a capital anywhere in the world. Skiers heading up to the hills above town can see the fjord glittering below.
Oslo shows that smart rules and a bit of patience can clear the sky, one tax at a time.
San José, Costa Rica
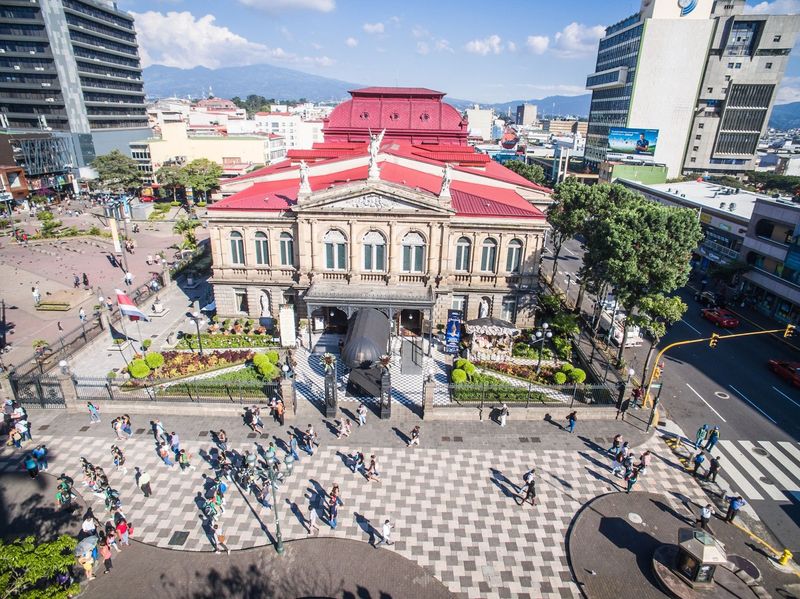
Green mountains ring San José, and the air stats look good too. The city recorded 6.1 micrograms per cubic meter of PM2.5 in IQAir’s 2025 dataset.
That is only a little above the WHO annual guideline.
It is also about one-fifth of the level seen in some heavily polluted capitals. Put side by side, the gap is huge.
One caution applies. PM2.5 is only one piece of the air quality puzzle.
Nitrogen oxides, ozone and other pollutants follow their own patterns and have their own health standards, so this is not a full report card.
A low yearly average also does not block short bad spells. Rush hour in a busy valley can still feel heavy.
What the number does give is a fair way to compare cities. Everyone on the list is measured with the same PM2.5 yardstick.
San José fits comfortably among the cleaner capitals. After a cup of local coffee in the city center, you can look up at the hills and feel pretty good about the view.
Tegucigalpa, Honduras
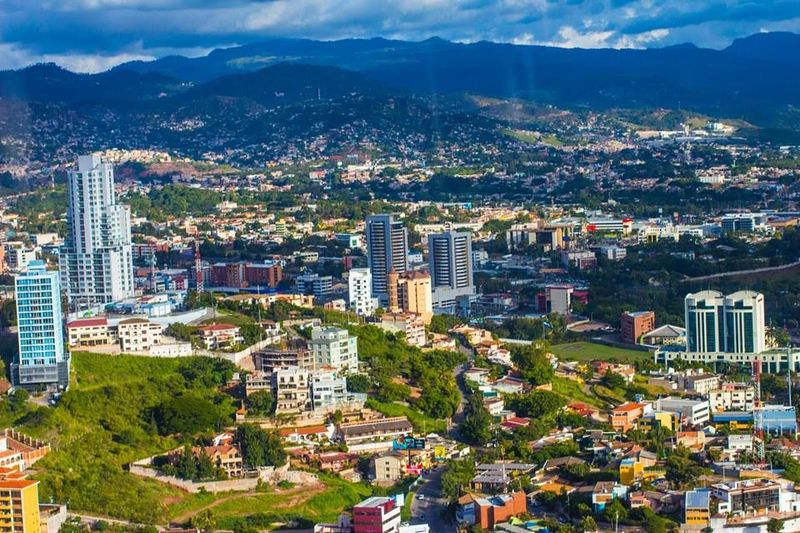
Surprise guest alert: Tegucigalpa lands on the clean end of IQAir’s 2025 capital ranking. Its PM2.5 average was 6.3 micrograms per cubic meter.
That is above the WHO guideline but low next to many capitals in the report.
Parts of South and Central Asia, Africa and the Middle East show far higher readings. Against those, the Honduran capital looks much better.
Some caution is wise. IQAir says monitoring systems around the world are very uneven.
Some regions have dense networks of stations, while others have only a few.
That means city comparisons come from the data available, not from a perfect count of pollution on every street. A neighborhood without a sensor could have a different story.
Even so, the figure is encouraging. The city sits in a mountain valley, and its hillside homes and old plazas look out over lots of open sky.
Think of this number as a good clue, not a final verdict. More monitoring would help everyone see the full picture, and breathing better is something worth tracking closely.
Dublin, Ireland
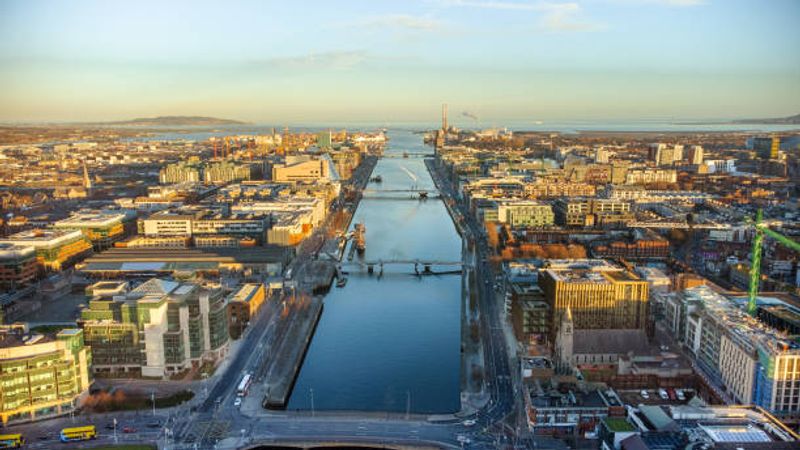
Between 2019 and 2025, Dublin shaved a lot off its air pollution. The 2019 PM2.5 average was 10.6 micrograms per cubic meter.
In 2025 it was 6.5, almost the same as 6.6 the year before.
Dublin City Council keeps constant watch on local air, working with Ireland’s Environmental Protection Agency. They track particles and gases alike, so changes show up quickly.
Rules on home heating have played a role. The country restricts the commercial sale of smoky fuels, including smoky coal, turf and wet wood.
Fewer smoky fires mean fewer fine particles floating around neighborhoods on cold nights.
Dublin is still above the WHO guideline of 5. Yet the trend is the star here.
Cutting that much in just a few years is no small feat.
Stroll along the Liffey on a breezy evening and you will feel the Atlantic air doing its job. A pint of something tasty is optional, but the clean breeze comes free of charge.
Sucre, Bolivia
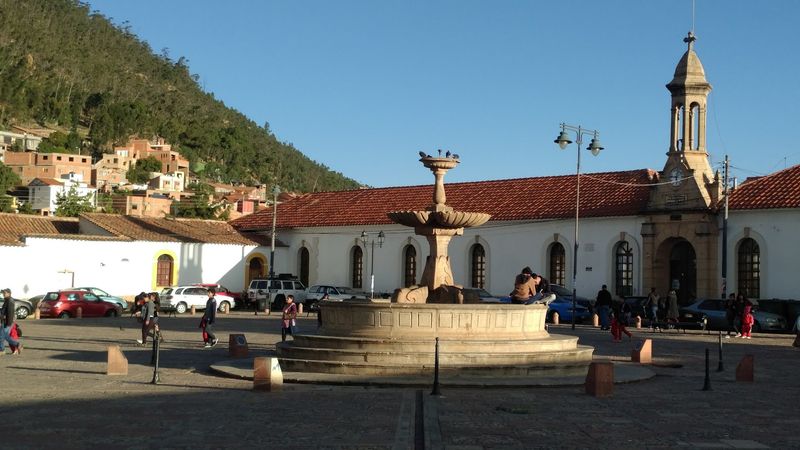
Bolivia has two capitals, and Sucre is the constitutional one. La Paz is the seat of government.
IQAir lists Sucre in its worldwide capital ranking, and it closes this list with 6.9 micrograms per cubic meter of PM2.5 in 2025.
That is about 38% above the WHO’s guideline of 5. Still, it is impressively low when set beside most capitals in the report.
The figure even puts Sucre ahead of Ottawa, Lisbon, Washington, Madrid, Amsterdam and London in this one comparison. That is a fun fact to share at the next trivia night.
Keep the limits in mind, though. This ranking covers one pollutant and one year.
It does not describe every part of environmental quality, so it should not be read as a full health check.
Known as the White City for its whitewashed colonial buildings, Sucre sits high in the Andes where the air is thin and bright. Wander its quiet plazas and you will see why clean skies suit it so well.
Share this story