
Not all roads are created equal, and not all cities make driving easy. Every year, Allstate releases its America’s Best Drivers Report, ranking hundreds of U.S. cities based on how often their drivers experience collisions.
The results can be surprising, especially when some of the country’s most iconic and well-known cities land at the very bottom of the list. If you live in or plan to drive through any of these 15 cities, knowing what you are up against can help you stay alert, drive defensively, and maybe even rethink your route.
From narrow historic streets in the Northeast to sprawling California freeways and fast-growing Nevada suburbs, these cities represent the toughest driving conditions in America right now.
Boston, Massachusetts
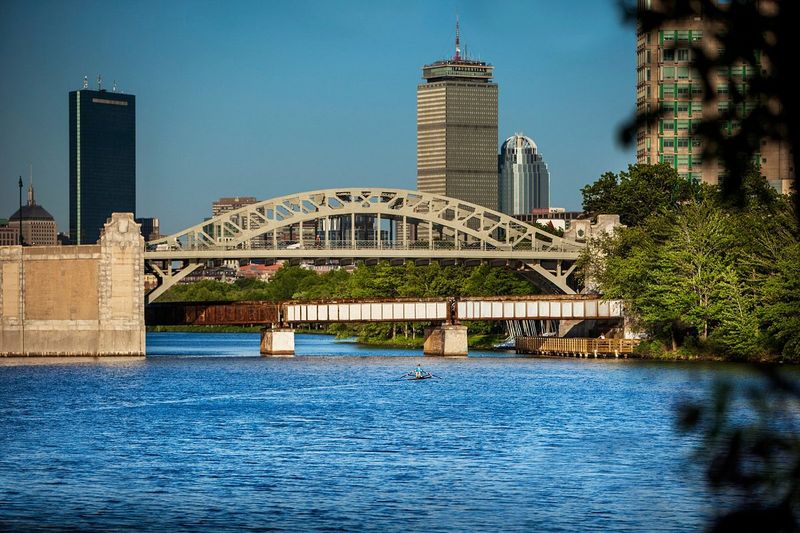
Boston holds the top spot on Allstate’s 2026 report as the single most collision-prone city in the entire country. Drivers there average just 3.76 years between collisions, which is dramatically lower than the national average.
That also means Boston drivers are 188.7% more likely to experience a crash than the typical U.S. driver.
Anyone who has navigated the city’s roads can understand why. Boston’s street layout was not designed for modern car traffic.
Many roads follow old colonial-era paths, creating tight curves, unexpected dead ends, and intersections that feel more like puzzles than thoroughfares.
Add in heavy commuter volume, aggressive driving habits that the city is famous for, dense neighborhoods, and constant construction, and the numbers start to make a lot of sense. Allstate’s claims data backs up what locals already know: driving in Boston requires full attention, patience, and a solid understanding of where you are going before you even turn the key.
Washington, D.C.

The nation’s capital earns second place on the Allstate list, and the data is striking. Drivers in Washington, D.C. average 4.24 years between collisions and are 156.3% more likely than the national average to experience one.
That puts D.C. firmly in the conversation as one of America’s most challenging driving environments.
The city’s road design includes traffic circles, diagonal avenues, and a grid system that can confuse even experienced drivers. Layer in government motorcades, tour buses, rideshare vehicles, cyclists, and pedestrians crossing at nearly every corner, and the daily commute becomes a serious exercise in focus.
Allstate also flagged that nighttime driving rates in Washington, D.C. are notably high. Driving after dark adds risk through reduced visibility and fatigue, two factors that contribute to higher collision rates.
For anyone passing through or living in the metro area, extra caution during evening hours is well worth keeping in mind.
Baltimore, Maryland

Baltimore takes third place in Allstate’s 2026 ranking, with drivers averaging 4.49 years between collisions. The city’s collision likelihood sits at 142.1% above the national average, making it one of the most statistically risky places to drive anywhere in the United States.
The city’s road challenges are layered. Baltimore has a dense urban core with older infrastructure, busy commuter corridors, and a road network that can shift quickly from wide arterials to tight residential streets with little warning.
Stop-and-go conditions are common during peak hours, and lane changes happen fast.
Baltimore also serves as a major transit point between Washington, D.C. and the rest of the Mid-Atlantic region, which keeps traffic volume high throughout the day. Public transit and walkable neighborhoods exist, but plenty of residents still depend on driving for daily life.
That combination of density, older roads, and constant movement keeps Baltimore near the very top of this list year after year.
Worcester, Massachusetts

Worcester proves that dangerous driving conditions are not exclusive to the country’s largest cities. As the second Massachusetts city in the top five, Worcester’s presence here sends a clear message about the state’s overall driving environment.
Drivers average 5.14 years between collisions, and they are 111.2% more likely than the national average to experience one.
The city’s geography plays a role. Worcester is built across a series of hills, and its road network includes older streets, tight turns, and busy commercial corridors that handle both local traffic and commuters traveling between central Massachusetts and the Greater Boston area.
Worcester is a mid-sized city with a real urban density, a large student population from multiple colleges, and active commercial zones that keep traffic moving in unpredictable patterns. Its ranking shows that factors like road age, commuting pressure, and city layout can push collision risk up just as effectively as sheer population size alone.
Springfield, Massachusetts

Three Massachusetts cities in the top five is not a coincidence. Springfield rounds out the group, ranking fifth with drivers averaging 5.18 years between collisions.
The city’s collision likelihood is 109.6% above the national average, which puts it in very close company with Worcester just above it on the list.
Springfield sits at a major transportation crossroads in western Massachusetts. Interstate 91 and Interstate 90 both run through the region, bringing a constant flow of highway traffic that mixes with local commuters and urban drivers navigating the city’s surface streets.
That overlap creates a demanding driving environment throughout the day.
The broader Massachusetts pattern in this report is hard to ignore. Boston, Worcester, and Springfield all ranking among the top five most collision-prone cities in the country suggests something systemic about the state’s roads, driving culture, and urban design.
If you are driving through Massachusetts, staying alert from one end of the state to the other is genuinely good advice.
Glendale, California

Southern California driving has a reputation, and Glendale’s numbers do nothing to soften it. Located in the Los Angeles metro area, Glendale ranks sixth with drivers averaging 5.53 years between collisions.
Allstate’s data puts the city’s collision likelihood at 96.5% above the national average.
Glendale handles a heavy mix of freeway traffic, dense surface streets, retail corridors, and commuters moving through the broader L.A. basin every single day. The city is compact but active, with shopping districts, office zones, and residential neighborhoods all competing for road space at the same time.
What makes Glendale notable on this list is that it is not the only California city to appear here. The state shows up multiple times in the bottom rankings, which reflects how car-dependent Southern California remains and how much pressure that puts on local road systems.
Glendale’s position in the top six confirms that the region’s driving challenges extend well beyond the City of Los Angeles itself.
Providence, Rhode Island

Rhode Island is the smallest state in the country, but Providence still manages to rank among the most collision-prone driving cities in America. Drivers there average 5.87 years between collisions, and the city’s collision likelihood is 85.1% above the national average according to Allstate’s 2026 report.
Providence shares many characteristics with other high-ranking Northeastern cities. Its streets are older, its intersections can be complicated, and the mix of local drivers, college students, commuters, and pedestrians creates a demanding environment throughout the week.
The city also serves as a regional hub, drawing traffic from across Rhode Island and nearby parts of Massachusetts and Connecticut.
Providence fits into a broader pattern that runs throughout this list. The Northeast is heavily represented among the most collision-prone cities in the country, and Providence’s ranking reinforces that trend.
Compact urban cores, historic street layouts, and dense populations appear to be consistent factors driving the numbers in this part of the country.
Sunrise Manor, Nevada

Sunrise Manor might not be a name that comes up often in national conversations, but its appearance near the bottom of Allstate’s 2026 ranking is worth paying attention to. Drivers there average 5.95 years between collisions, with a collision likelihood 82.6% higher than the national average.
Located in the Las Vegas Valley, Sunrise Manor is an unincorporated community in Clark County rather than a standalone city. That distinction does not change the driving reality on its roads.
Fast-moving arterials, regional commuting patterns, and the broader traffic flow of the Las Vegas metro area all affect conditions in Sunrise Manor daily.
Its placement on this list also challenges the assumption that high collision risk is mainly a problem for older East Coast cities with narrow historic streets. Sunrise Manor shows that newer suburban layouts with wide roads and high speeds can generate elevated crash risk just as effectively.
The Las Vegas metro area appears multiple times in this ranking, and Sunrise Manor is the first of several Nevada entries.
Los Angeles, California

Honestly, Los Angeles showing up on a list of collision-prone cities will not raise many eyebrows. The city ranks ninth with drivers averaging 5.99 years between collisions and a collision likelihood that is 81.5% higher than the national average.
Those numbers reflect a driving environment that millions of people navigate every single day.
L.A. freeways like the 405, the 101, and the 10 are among the busiest stretches of road in the entire country. Surface streets in neighborhoods like Hollywood, downtown, and Koreatown are no easier.
The city’s scale means that most residents spend a significant portion of their day behind the wheel, which naturally increases exposure to potential collisions.
Car dependence is baked into Los Angeles life in a way that differs from most other large American cities. Public transit exists but does not yet serve enough of the metro to reduce car volume significantly.
Until that changes, L.A.’s spot near the bottom of the Allstate rankings is likely to remain a fixture in future reports as well.
Philadelphia, Pennsylvania

Philadelphia closes out the top ten on Allstate’s 2026 list, with drivers averaging 6.12 years between collisions. The city’s collision likelihood is 77.6% above the national average.
For a city known for its passionate residents and historic character, the driving data adds a less charming chapter to the story.
Philly’s roads are genuinely tough to navigate. Narrow streets in neighborhoods like South Philly and Fishtown, parallel parking on both sides of tight blocks, constant delivery traffic, and heavy pedestrian movement all create conditions where collisions are more likely.
Add in the volume of commuters coming in and out of Center City each day, and the pressure on the road network becomes clear.
Philadelphia also fits the Northeast pattern that runs through this entire report. Boston, Baltimore, Washington D.C., Providence, and now Philadelphia all rank among the most collision-prone cities in the country.
Something about older Northeastern urban design consistently produces elevated crash risk, and Philadelphia is a strong example of that pattern.
Oakland, California

Oakland sits just outside the top ten but still ranks among the most challenging driving cities in the United States. Drivers there average 6.20 years between collisions, and Allstate places Oakland’s collision likelihood at 75.1% higher than the national average.
That is a meaningful gap from the typical U.S. driver’s experience.
Oakland’s traffic is shaped by several overlapping forces. Bay Area commuters use Oakland as a major connector between San Francisco and the East Bay.
Port of Oakland activity generates constant truck traffic on key corridors. Freeway connections like I-880 and I-580 carry heavy loads throughout the day, and residential neighborhoods absorb the overflow when those routes back up.
Oakland is the third California city on this list, which reinforces a statewide theme. California’s combination of car dependency, population density, and major freight movement creates conditions that push collision rates higher than most of the country.
Oakland’s ranking reflects all three of those factors working at the same time.
Alexandria, Virginia

Alexandria, Virginia ranks twelfth on the list, with drivers averaging 6.21 years between collisions. The city’s collision likelihood is 75.0% above the national average.
That figure is almost identical to Oakland’s, which landed just one spot higher, showing how tightly grouped the middle of this ranking really is.
Alexandria’s position inside the Washington, D.C. metro area explains a lot. The city absorbs commuter traffic from across Northern Virginia, shares road space with federal workers, tourists visiting historic Old Town, cyclists using the Mount Vernon Trail, and local residents going about daily life.
That is a lot of competing movement on roads that were not all built for modern traffic volume.
The historic streets of Old Town Alexandria add character, but they also add complexity. Brick-paved roads, tight parking situations, and pedestrian-heavy zones create conditions where drivers need to slow down and stay alert.
Alexandria’s ranking shows that even a city celebrated for its walkability and charm can still present real challenges behind the wheel.
Grand Rapids, Michigan
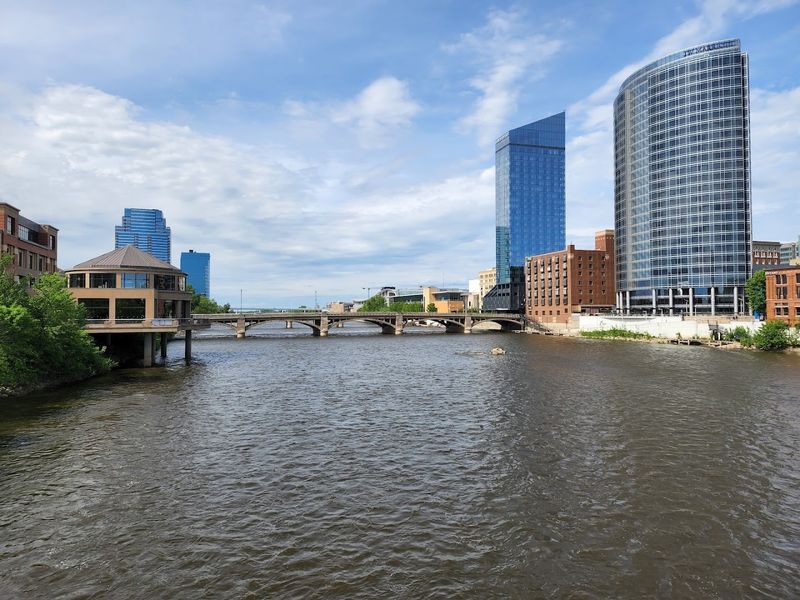
Grand Rapids stands out on this list for a couple of reasons. First, it is one of the few Midwest cities to appear in the bottom 15.
Second, Allstate includes a notable caveat about Michigan in the report. The state’s no-fault insurance system can affect how certain claims are recorded, which means Grand Rapids results may not be directly comparable to every other city on the list.
Even with that caveat noted, Grand Rapids still ranks thirteenth with drivers averaging 6.62 years between collisions and a collision likelihood 64.1% above the national average. The city is a growing regional hub with steady commuter traffic, active commercial zones, and winter weather that adds seasonal driving challenges from late fall through early spring.
Ice, snow, and reduced visibility during Michigan winters are real factors that affect road safety. Grand Rapids is a vibrant, expanding city, but its roads carry the weight of that growth along with conditions that can make driving more unpredictable than in warmer-weather metros.
North Las Vegas, Nevada
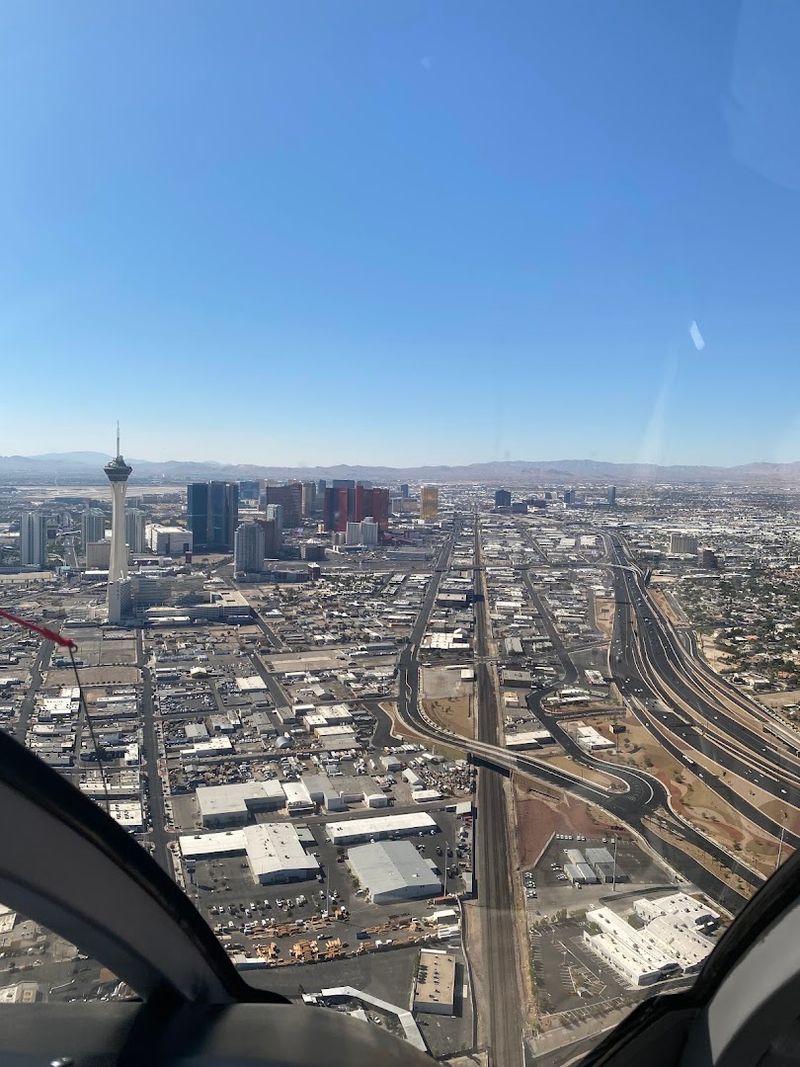
North Las Vegas ranks fourteenth on the list, with drivers averaging 6.63 years between collisions. Its collision likelihood is 63.9% above the national average.
The one-hundredth of a year separating it from Grand Rapids shows just how competitive the lower end of this ranking gets.
As part of the greater Las Vegas metro area, North Las Vegas deals with fast-growing suburban traffic, wide arterial roads that encourage higher speeds, and a constant flow of commuters and visitors moving across the valley. The city has expanded rapidly in recent decades, and road infrastructure does not always keep pace with population growth.
What stands out here is how many times the Las Vegas metro appears in this report. Sunrise Manor, Paradise, Spring Valley, Las Vegas proper, and now North Las Vegas all show elevated collision risk.
That regional pattern suggests the Las Vegas Valley’s road design, traffic culture, and rapid growth are combining to create conditions that are harder on drivers than the city’s image as an entertainment destination might suggest.
Bridgeport, Connecticut

Bridgeport closes out the list as the fifteenth most collision-prone city in Allstate’s 2026 report. Drivers there average 6.64 years between collisions, and the city’s collision likelihood is 63.7% above the national average.
Connecticut’s largest city earns its spot here through a combination of factors that are familiar across this entire list.
Bridgeport sits directly along the I-95 corridor, one of the most heavily traveled highway routes in the entire Northeast. Regional commuters, freight trucks, and local drivers all share that stretch of road daily, and the pressure spills onto city streets throughout the day.
Dense urban neighborhoods and limited road capacity make the situation more complicated.
Bridgeport’s presence on this list also reinforces the report’s most consistent finding. Northeastern cities dominate the bottom rankings, and Connecticut joins Massachusetts, Rhode Island, Maryland, Pennsylvania, Virginia, and Washington D.C. as states where driving conditions consistently produce higher collision rates.
If you are driving the I-95 corridor through Connecticut, Bridgeport is a stretch where staying focused genuinely matters.
Share this story